Certification track: Professional Cloud DevOps Engineer (PDE)
Grafana on GKE Autopilot
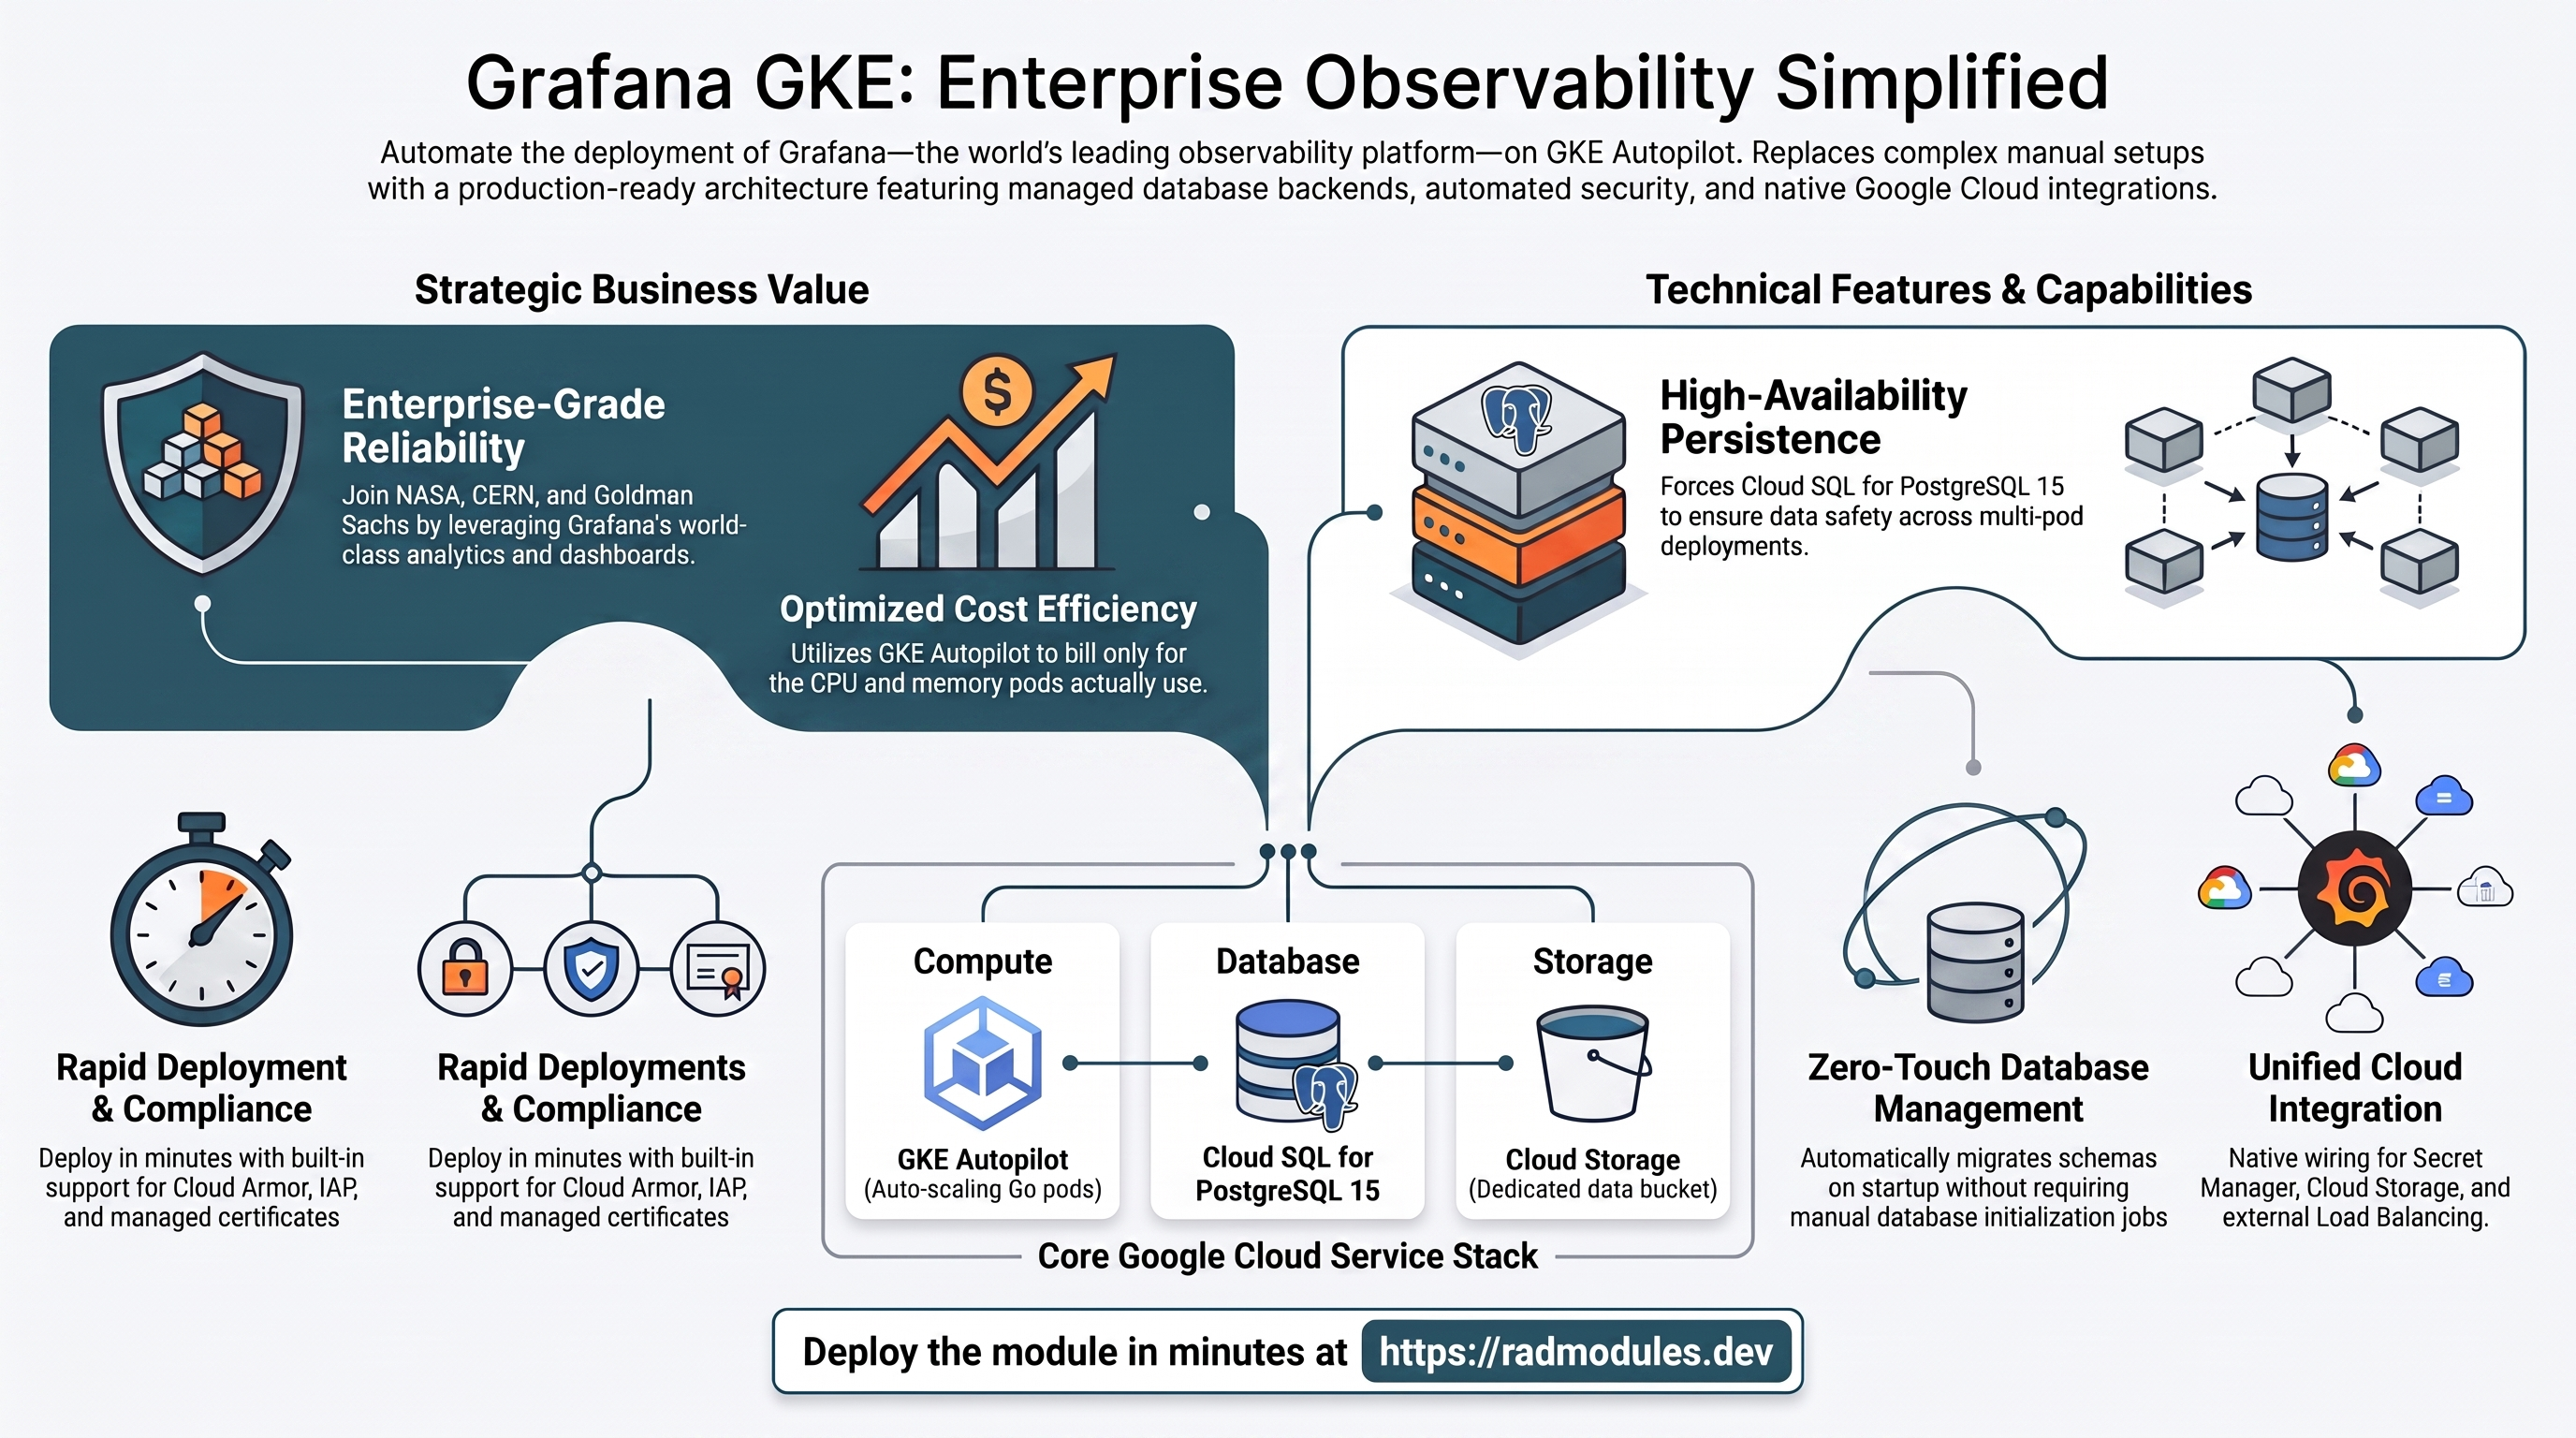
Grafana is the world's leading open-source observability and analytics platform, used by 10M+ users at organisations including NASA, CERN, and Goldman Sachs. It provides unified dashboards, alerting, and visualisation for metrics, logs, and traces from over 100 data sources. This module deploys Grafana on GKE Autopilot on top of the App_GKE foundation, which provisions and manages the shared Google Cloud and Kubernetes infrastructure.
This guide focuses on the cloud services Grafana uses and how to explore and operate them from the Google Cloud Console and the command line. For the mechanics that are common to every GKE application — Workload Identity, ingress, autoscaling, CI/CD, Cloud Armor, IAP, Binary Authorization, VPC Service Controls, backups, and the deployment lifecycle — refer to the App_GKE foundation guide rather than repeating them here.
What Grafana costs on RAD, and how that compares
Running Grafana on GKE Autopilot pod in your own Google Cloud project costs about $96.70/month in Google Cloud charges, on top of a one-off 75-credit RAD module fee charged once at deploy time. Grafana is unusual on this list in having its own official hosted SaaS, run by Grafana Labs itself, which makes a direct comparison possible rather than a generic one. In a RAD-managed project the module fee drops to 67.5 credits (10% lower) and the running cost is metered hourly in credits instead of billed directly by Google — see Pause it for free below for the one RAD-managed advantage a self-hosted VPS cannot match — or see the Cloud Run guide for the lower-cost option.
What you pay on RAD
| Own project | RAD-managed project | |
|---|---|---|
| Module fee (one-off) | 75 credits | 67.5 credits (10% lower) |
| Build time | ~3-6 credits per build, either way | ~3-6 credits per build, either way |
| Google Cloud running cost | $96.70/month, billed by Google at list price | ~91 credits/day, metered at list price plus RAD's margin |
Default running cost in your own project
| Resource | US$/month (Google list price, us-central1) |
|---|---|
| GKE Autopilot pod, 1x vCPU / 2 GiB | $39.68 |
| Cloud SQL for PostgreSQL, 1 vCPU / 3.75 GB, zonal, 10 GB SSD | $51.02 |
| Cloud NAT and networking | $5.00 |
| Cloud Storage (add-ons, backups) | $1.00 |
| GKE cluster management fee | shared across every GKE app in the project; $0 if this is your only cluster, else ~73 |
| Total | $96.70 |
The GKE cluster management fee is excluded from the total above because it is shared across every GKE app in the project — $0 if this is the only one, otherwise roughly $73/month split across however many you run.
How it compares
- Grafana Cloud's Free tier is $0/month (usage-capped, 14-day retention), and its lowest paid tier, Pro, starts at $19/month as a platform fee plus usage-based charges on top (for example metrics billed from $6.50 per 1,000 series beyond the included allowance) — verified from Grafana's own pricing page, 8 October 2026.
- RAD's own-project running cost here is dashboards plus a dedicated Postgres database for Grafana's own state, which Grafana Cloud's hosted tiers fold into their usage pricing instead of billing as a separate Cloud SQL instance.
- A self-managed VPS alternative, sized to this module: Hetzner CPX22 (2 vCPU/4GB) runs about $24/mo, a DigitalOcean 2 vCPU/4GB Droplet is the same $24/mo, and a GCP Compute Engine e2-standard-2 (2 vCPU/8GB) is about $49/mo — cheaper than either Grafana Cloud's Pro tier or RAD's managed stack in sticker price, but with no managed backups or patching included.
Pause it for free: delete a RAD-managed project, restore it when you need it
This is the headline advantage of a RAD-managed project, and it costs nothing while paused. Deleting a RAD-managed project unlinks its billing first, then asks Google to delete the project outright — Google's own 30-day recoverable soft delete. Unlike deleting one module, this does not tear down Cloud SQL, any VM, or the compute resource one by one: the whole project simply stops, and nothing is charged while it waits, because billing is already unlinked.
Restoring, within 30 days and only by the project's owner, asks Google to undelete the project and reattaches its billing account, then asks you to run Update on each deployment to confirm everything came back. Because nothing was individually destroyed, that Update finds the same resources already there — it is a check, not a rebuild, and an Update never charges the module fee again. This costs only a handful of credits (under US$1) in total for a typical 2-3-deployment chain.
What this needs: you must own the project (not one RAD only manages billing for), you must restore it yourself within 30 days — after that Google deletes it for good — and restoring is admitted like creating a new project, so your purchased credit balance must still clear the tier's floor (100 credits for the sandbox tier most study/demo use fits). Google says most services are fully working again within 36 hours of a restore.
One real gap: nightly backups are written to a bucket inside the project, and that bucket has Cloud Storage's soft-delete explicitly turned off, so it is very likely gone as soon as you delete the project — even though the project itself is recoverable for 30 days. If you've customised Grafana and want to keep that work, copy a backup out (to Google Drive, or a bucket outside the project) before deleting. For a default install with nothing irreplaceable in it, this does not matter.
Pay only while you use it, the other way: delete and redeploy
In your own project, or once 30 days have passed on a RAD-managed one, there is no free pause — deleting removes the resources for good, and bringing Grafana back means redeploying from scratch. That costs about 78-81 credits (the 75-credit module fee plus a build).
Deleting only saves money once Grafana would otherwise sit unused long enough to clear that redeploy cost against its own running cost — for Grafana, that's about 3 days or more. Most of that running cost is usually the database (and, where this module uses one, the shared file-server VM or GKE cluster) — those stop only once nothing else in the project uses them, so deleting this app while something else shares the project saves only its own compute share.
Keep data first: nightly backups go to a bucket inside the deployment and are deleted with it, so copy the latest backup out before deleting if you want to keep it.
Lab sessions and Managed Environments
Lab sessions, for training: a trainer runs a session for a class. Each participant gets the app in their own Google Cloud project for 15 minutes to 24 hours, within an allowance the trainer sets. Either the trainer funds every place, or each participant pays for their own. Everything is deleted when the session ends and unused credits go back to the trainer.
Managed Environments, for consultancies: a partner runs the app for a client from a ring-fenced wallet it funds, and settles with the client directly. If the wallet runs low, billing pauses and the data is kept, so nobody receives an unexpected charge. At the end the partner hands the project over and the deployments become the client's own.
Credits can be bought in more than 20 currencies, including XAF, XOF, NGN, GHS, KES and ZAR, by card, bank transfer or mobile money.
Sources (8 October 2026): Google Cloud Billing Catalog API list prices; radmodules.dev/pricing for RAD's own fees and daily-credit estimates; Google's project delete/restore documentation for the pause/restore claims; https://grafana.com/pricing/ for the Grafana Cloud figures quoted above, verified 8 October 2026.
1. Overview
Grafana runs as a Go web workload. The deployment wires together a focused set of Google Cloud services:
| Capability | Google Cloud service | Notes |
|---|---|---|
| Compute | GKE Autopilot | Go pods, 1 vCPU / 2 GiB by default, horizontally autoscaled |
| Database | Cloud SQL for PostgreSQL 15 | Required — Grafana requires a relational DB; SQLite is unsafe for multi-pod deployments |
| Object storage | Cloud Storage | A grafana-data bucket provisioned automatically |
| Optional shared storage | Filestore (NFS) | Disabled by default; enable to share dashboards or plugins across replicas |
| Optional cache | Redis | Disabled by default; can be enabled for session storage |
| Secrets | Secret Manager | Database password managed by the foundation; admin credentials injected via env var |
| Ingress | Cloud Load Balancing | External LoadBalancer, optional custom domain + managed certificate |
Sensible defaults worth knowing up front:
- PostgreSQL 15 is required. Grafana persists dashboards, users, alerts, and plugin state in a relational database. SQLite uses file locking that breaks under concurrent multi-pod writes; the module forces PostgreSQL.
GF_DATABASE_TYPE=postgresis injected automatically. Without it Grafana falls back to SQLite even when all otherGF_DATABASE_*variables are present.- No database init job is needed. Grafana auto-migrates its schema on first
startup, so no
db-initKubernetes Job is required. stateful_fs_group = 472. Grafana runs as UID/GID 472; this ensures the container can write to StatefulSet PVC mounts without permission errors.- NFS is disabled by default. Enable it when multiple replicas need to share Grafana plugins or custom dashboards on a shared filesystem.
- Redis is disabled by default. Grafana does not require Redis for its core function; enable it only when session-storage consistency across many replicas is required.
2. Google Cloud Services & How to Explore Them
All commands assume you have run
gcloud container clusters get-credentials <cluster> --region <region> --project <project>
and that PROJECT, REGION, and NAMESPACE are set. The namespace and other
identifiers are reported in the deployment Outputs.
A. GKE Autopilot — the Grafana workload
Grafana pods are scheduled on Autopilot, which bills for the CPU/memory the pods actually request. Horizontal Pod Autoscaling sizes the deployment between the minimum and maximum replica counts.
- Console: Kubernetes Engine → Workloads → select the Grafana workload to see pods, revisions, and events. Kubernetes Engine → Services & Ingress shows the external IP.
- CLI:
kubectl get pods,svc,hpa -n "$NAMESPACE"
kubectl logs -n "$NAMESPACE" deploy/<service-name> --tail=100
kubectl describe hpa -n "$NAMESPACE"          # current vs target utilisation
See App_GKE for how Autopilot, scaling, and the workload type (Deployment vs StatefulSet) are managed.
B. Cloud SQL for PostgreSQL 15
Grafana stores all application data (dashboards, users, organisations, alert rules, plugin state) in a managed Cloud SQL for PostgreSQL 15 instance. Pods reach it privately through the Cloud SQL Auth Proxy sidecar over a Unix socket, so no public IP is exposed. Grafana auto-migrates its schema on startup — no separate init job is required.
- Console: SQL → select the instance for connections, backups, flags, and metrics.
- CLI:
gcloud sql instances list --project "$PROJECT"
gcloud sql instances describe <instance-name> --project "$PROJECT"
# Open an interactive shell to inspect schema/data:
gcloud sql connect <instance-name> --user=<db-user> --project "$PROJECT"
The instance name, database name, user, and the Secret Manager secret holding the password are all surfaced in the Outputs. For the connection model, automated backups, and password rotation, see App_GKE.
C. Cloud Storage
A dedicated grafana-data Cloud Storage bucket is provisioned automatically by
Grafana_Common. The workload service account is granted access. Additional GCS
buckets can be declared via storage_buckets, and GCS Fuse volumes can be mounted
into pods via gcs_volumes.
- Console: Cloud Storage → Buckets.
- CLI:
gcloud storage buckets list --project "$PROJECT"
gcloud storage ls gs://<grafana-data-bucket>/    # bucket name is in the Outputs
See App_GKE for GCS Fuse, CMEK options, and lifecycle policies.
D. Filestore (NFS) — optional
When enable_nfs = true, a Filestore NFS share is provisioned and mounted into
pods. This is useful when multiple replicas need to share Grafana plugins or custom
dashboard templates on a shared filesystem. NFS is disabled by default because
Grafana's persistent state lives in PostgreSQL, not on the local filesystem.
- Console: Filestore → Instances.
- CLI:
gcloud filestore instances list --project "$PROJECT"
# Confirm the share is mounted inside a pod:
kubectl exec -n "$NAMESPACE" deploy/<service-name> -- df -h | grep -i nfs
E. Secret Manager
The database password is stored as a Secret Manager secret and injected into pods at
runtime. Grafana's admin password is not auto-generated by this module — it must be
injected via secret_environment_variables (see §3 below).
- Console: Security → Secret Manager.
- CLI:
gcloud secrets list --project "$PROJECT"
gcloud secrets versions access latest --secret=<secret-name> --project "$PROJECT"
The database password secret name is in the Outputs. See App_GKE for the Secret Store CSI integration and rotation.
F. Networking & ingress
The workload is exposed through an external Cloud Load Balancing IP. enable_custom_domain
defaults to true, provisioning a Kubernetes Ingress with a Google-managed certificate for
the hostnames in application_domains; a static IP is reserved by default so the address
survives redeploys.
- Console: Network services → Load balancing; VPC network → IP addresses.
- CLI:
kubectl get ingress,svc -n "$NAMESPACE"
gcloud compute addresses list --project "$PROJECT"
See App_GKE for custom domains, Cloud CDN, and static IP details.
G. Cloud Logging & Monitoring
Pod stdout/stderr flow to Cloud Logging; GKE and Cloud SQL metrics flow to Cloud
Monitoring. Grafana exposes /api/health as its health endpoint, targeted by both
startup and liveness probes, and optionally by a Cloud Monitoring uptime check.
- Console: Logging → Logs Explorer; Monitoring → Dashboards / Alerting.
- CLI:
gcloud logging read 'resource.type="k8s_container" AND resource.labels.namespace_name="'"$NAMESPACE"'"' \
  --project "$PROJECT" --limit 50
3. Grafana Application Behaviour
- Schema migration on startup. Grafana connects to PostgreSQL and applies any
pending schema migrations on first boot. No separate database initialisation job
is needed. The startup probe allows ~150 seconds total tolerance for first-boot
migrations (
initial_delay_seconds=30,failure_threshold=12,period_seconds=10). - Admin credential. Grafana ships with default
admin/admincredentials. The module does NOT auto-generate or rotate the admin password. You must inject a strong password viasecret_environment_variables:Retrieve the current password:# Create a secret for the admin password:
gcloud secrets create grafana-admin-password \
--replication-policy="automatic" --project "$PROJECT"
printf 'yourStrongPassword' | gcloud secrets versions add grafana-admin-password \
--data-file=- --project "$PROJECT"
# Then set in your deployment config:
# secret_environment_variables = { GF_SECURITY_ADMIN_PASSWORD = "grafana-admin-password" }gcloud secrets versions access latest --secret=grafana-admin-password --project "$PROJECT" GF_DATABASE_TYPEis injected automatically. The module forcesGF_DATABASE_TYPE=postgresinto the environment. Do not override this inenvironment_variables.- StatefulSet PVCs. When
stateful_pvc_enabled = true, each pod gets a dedicated PVC mounted at/var/lib/grafana.stateful_fs_group = 472ensures Grafana (UID/GID 472) can write to that path. Inspect PVC status:kubectl get pvc -n "$NAMESPACE"
kubectl describe pvc -n "$NAMESPACE" - Health endpoint. Both startup and liveness probes target
/api/health, which returns HTTP 200 when Grafana and its database connection are healthy. - No scheduled jobs required. Unlike campaign-driven applications, Grafana has
no mandatory CronJobs. Optional cron jobs (e.g. snapshot export, cleanup) can be
added via
cron_jobs.
4. Configuration Variables
Variables are grouped exactly as they appear on the deployment platform. Only settings specific to or notable for Grafana are listed; every other input is inherited from App_GKE with its standard behaviour and defaults.
Group 1 — Project & Identity
| Variable | Default | Description |
|---|---|---|
project_id | (required) | Target Google Cloud project. |
region | us-central1 | Region for the workload and regional resources. |
Group 2 — Deployment Environment
| Variable | Default | Description |
|---|---|---|
tenant_id | demo | Short suffix that makes resource names unique per environment. |
support_users | [] | Emails granted project access and monitoring alerts. |
resource_labels | {} | Labels applied to all resources for cost/ownership tracking. |
Group 3 — Application Identity
| Variable | Default | Description |
|---|---|---|
application_name | grafana | Base name for resources. Do not change after first deploy. |
application_display_name | Grafana Dashboards | Friendly name shown in the Console. |
application_description | Grafana observability platform on GKE Autopilot | Workload description annotation. |
application_version | 11.4.0 | Grafana image version tag; increment to roll out a new version. |
Group 4 — Runtime & Scaling
| Variable | Default | Description |
|---|---|---|
deploy_application | true | Set false to provision infrastructure only. |
container_resources | { cpu_limit="1000m", memory_limit="2Gi" } | CPU/memory limits and optional requests for the Grafana container. |
min_instance_count | 1 | Minimum replicas. Keep ≥ 1 to avoid cold starts for alert evaluation. |
max_instance_count | 5 | Maximum replicas (autoscaler ceiling). |
container_port | 3000 | Grafana listens on port 3000. |
enable_cloudsql_volume | true | Cloud SQL Auth Proxy sidecar for socket connections. |
enable_vertical_pod_autoscaling | false | Let Autopilot tune resource requests automatically. |
enable_image_mirroring | true | Mirror the Grafana image into Artifact Registry before deploy. |
Group 5 — Environment Variables & Secrets
| Variable | Default | Description |
|---|---|---|
environment_variables | {} | Extra non-secret GF_* settings. GF_DATABASE_TYPE=postgres is injected automatically — do not override. |
secret_environment_variables | {} | Map of env var → Secret Manager secret name. Use to inject GF_SECURITY_ADMIN_PASSWORD. |
Group 6 — GKE Backend & Cluster
| Variable | Default | Description |
|---|---|---|
service_type | LoadBalancer | How the Service is exposed. |
session_affinity | None | Round-robin by default — Grafana is stateless with PostgreSQL. |
workload_type | null | Auto-resolves to StatefulSet when stateful_pvc_enabled = true. |
network_tags | ['nfsserver'] | Node/pod tags; nfsserver is required for NFS connectivity if NFS is enabled. |
Group 7 — StatefulSet Configuration
| Variable | Default | Description |
|---|---|---|
stateful_pvc_enabled | null | Enable PVC templates for local data persistence. Setting true auto-selects StatefulSet. |
stateful_pvc_size | 10Gi | Storage size per PVC. |
stateful_pvc_mount_path | /var/lib/grafana | Grafana's default data directory — mount PVCs here. |
stateful_pvc_storage_class | standard-rwo | Kubernetes StorageClass for PVCs. |
stateful_fs_group | 472 | Pod-level fsGroup — must be 472 so Grafana (UID/GID 472) can write to PVC mounts. |
stateful_headless_service | null | Create a headless Service for stable pod DNS entries. |
stateful_pod_management_policy | null | OrderedReady or Parallel pod creation order. |
stateful_update_strategy | null | RollingUpdate or OnDelete. |
Group 8 — Resource Quota
| Variable | Default | Description |
|---|---|---|
enable_resource_quota | false | Cap namespace CPU/memory/object counts. |
quota_memory_requests / quota_memory_limits | "" | Must use binary units (4Gi, 8192Mi) — bare integers are read as bytes and block scheduling. |
Group 9 — Reliability Policies
| Variable | Default | Description |
|---|---|---|
enable_pod_disruption_budget | true | Protect availability during node upgrades. |
pdb_min_available | 1 | Minimum pods available during voluntary disruptions. |
enable_topology_spread | false | Spread pods across zones for high availability. |
Group 10 — Observability & Health
| Variable | Default | Description |
|---|---|---|
startup_probe_config | /api/health, 15s delay, 12 failures | HTTP probe against Grafana's health endpoint. |
health_check_config | /api/health, 30s delay, 3 failures | Kubernetes liveness probe. |
uptime_check_config | disabled | Optional Cloud Monitoring uptime check targeting /api/health. |
alert_policies | [] | Optional metric alert policies. |
Group 11 — Jobs & Scheduled Tasks
| Variable | Default | Description |
|---|---|---|
initialization_jobs | [] | Leave empty — Grafana auto-migrates its schema on startup. |
cron_jobs | [] | Optional scheduled Kubernetes CronJobs (e.g. snapshot export). |
additional_services | [] | Sidecar or helper services deployed alongside Grafana. |
Group 12 — CI/CD & GitHub Integration
Standard App_GKE Cloud Build / Cloud Deploy integration — see
App_GKE. Key inputs: enable_cicd_trigger,
github_repository_url, github_token, enable_cloud_deploy.
Group 13 — Filesystem (NFS)
| Variable | Default | Description |
|---|---|---|
enable_nfs | false | Shared Filestore volume — enable when multiple replicas need to share plugins or dashboard templates. |
nfs_mount_path | /mnt/nfs | Mount path inside the container. |
Group 14 — Cloud Storage & Artifact Registry
| Variable | Default | Description |
|---|---|---|
create_cloud_storage | true | Provision the GCS buckets declared in storage_buckets. |
storage_buckets | [] | Additional buckets to provision (the grafana-data bucket is always created by Grafana_Common). |
gcs_volumes | [] | GCS Fuse volume mounts via CSI. |
manage_storage_kms_iam / enable_artifact_registry_cmek | false | CMEK options. |
Group 15 — Redis Cache
| Variable | Default | Description |
|---|---|---|
enable_redis | false | Enable Redis for session storage. Disabled by default — not required for core Grafana function. |
redis_host | "" | Redis endpoint. Leave blank to use the NFS server IP when NFS is enabled. |
redis_port | 6379 | Redis port. |
redis_auth | "" | Optional Redis auth password (sensitive). |
Group 16 — Database Backend
| Variable | Default | Description |
|---|---|---|
database_type | POSTGRES_15 | Fixed — do not change; PostgreSQL is required. |
application_database_name | grafana | Database name. Immutable after first deploy. |
application_database_user | grafana | Application user. Immutable after first deploy. |
database_password_length | 32 | Generated password length (16–64). |
enable_postgres_extensions | false | Enable installation of PostgreSQL extensions. |
postgres_extensions | [] | List of extensions to install (e.g. ['pg_trgm']). |
enable_auto_password_rotation | false | Zero-downtime DB password rotation. |
Group 17 — Backup & Maintenance
| Variable | Default | Description |
|---|---|---|
backup_schedule | 0 2 * * * | Automated backup cron (UTC). |
backup_retention_days | 7 | Retention; raise to 30–90 for production/compliance. |
enable_backup_import / backup_source / backup_uri / backup_format | restore options | Restore from a backup on deploy. |
Group 18 — Custom SQL Scripts
enable_custom_sql_scripts, custom_sql_scripts_bucket, custom_sql_scripts_path,
custom_sql_scripts_use_root — run SQL from a GCS bucket after provisioning. See
App_GKE.
Group 19 — Custom Domain, Static IP & Networking
| Variable | Default | Description |
|---|---|---|
enable_custom_domain | true | Provision Ingress for custom hostnames + managed certificate. |
application_domains | [] | Hostnames to serve. |
reserve_static_ip | true | Stable external IP across redeploys. |
Group 20 — Identity-Aware Proxy (IAP)
| Variable | Default | Description |
|---|---|---|
enable_iap | false | Require Google sign-in in front of Grafana. Strongly recommended for internal deployments. |
iap_authorized_users / iap_authorized_groups | [] | Who may access. |
iap_oauth_client_id / iap_oauth_client_secret | "" | Required when IAP is enabled (sensitive). |
iap_support_email | "" | Shown on the OAuth consent screen. |
Group 21 — Cloud Armor
| Variable | Default | Description |
|---|---|---|
enable_cloud_armor | false | Attach a Cloud Armor (WAF) policy to the Ingress backend. |
admin_ip_ranges | [] | CIDRs allowed privileged access. |
cloud_armor_policy_name | default-waf-policy | Policy name. |
enable_cdn | false | Enable Cloud CDN on the GKE Ingress backend. |
Group 22 — VPC Service Controls & Audit Logging
| Variable | Default | Description |
|---|---|---|
enable_vpc_sc | false | Enforce a VPC-SC perimeter (requires organization_id). |
vpc_cidr_ranges / vpc_sc_dry_run | (set) | Access level CIDRs / dry-run mode. |
enable_audit_logging | false | Detailed Cloud Audit Logs. |
5. Outputs
These values are returned on a successful deployment and are the quickest way to locate and explore the running resources.
| Output | Description |
|---|---|
service_name | Kubernetes Service name. |
namespace | Namespace the workload runs in. |
service_cluster_ip | In-cluster ClusterIP. |
service_external_ip | External LoadBalancer IP (when a static IP is reserved). |
service_url | URL to reach Grafana. |
database_instance_name | Cloud SQL instance name. |
database_name | Application database name. |
database_user | Application database user. |
database_password_secret | Secret Manager secret holding the DB password. |
database_host / database_port | DB endpoint (127.0.0.1 via the Auth Proxy) / port. |
storage_buckets | Created Cloud Storage buckets (includes the grafana-data bucket). |
network_name / network_exists / regions | VPC network, presence, available regions. |
container_image / container_registry | Deployed image and Artifact Registry repo. |
monitoring_enabled / monitoring_notification_channels | Monitoring status and channels. |
initialization_jobs / db_import_job | Names of the setup and (optional) import jobs. |
deployment_id / tenant_id / resource_prefix | Naming identifiers. |
project_id / project_number | Project identifiers. |
cicd_enabled / cicd_configuration | CI/CD status and details. |
kubernetes_ready | Whether the cluster/workload is ready. |
vpc_sc_enabled / vpc_sc_perimeter_name / vpc_sc_dry_run_mode | VPC-SC status. |
audit_logging_enabled / artifact_registry_cmek_enabled | Audit logging and CMEK status. |
6. Configuration Pitfalls & Sensible Defaults
Risk: Critical (data loss / outage / security) — High (service degraded) — Medium (cost or partial degradation) — Low (minor).
| Setting | Sensible value | Risk | Consequence if wrong |
|---|---|---|---|
GF_SECURITY_ADMIN_PASSWORD (via secret_environment_variables) | strong secret | Critical | Grafana ships with default admin/admin credentials. Not setting a strong password exposes the admin interface. |
GF_AUTH_ANONYMOUS_ENABLED (via environment_variables) | false (default) | Critical | Setting to "true" exposes all dashboards without authentication. |
database_type | POSTGRES_15 | Critical | PostgreSQL is required; overriding to SQLite causes data loss on every pod restart. |
application_database_name / _user | set once | Critical | Immutable after first deploy; renaming recreates the DB/user and destroys data. |
enable_backup_import | false unless restoring | Critical | Enabling without a valid backup_uri fails the import job. |
quota_memory_requests / _limits | binary units | Critical | Bare integers are bytes and block all scheduling. |
GF_SERVER_ROOT_URL (via environment_variables) | public URL | High | Without it OAuth redirects, email links, and iframes point to the wrong origin. |
enable_iap | true for internal | High | Without IAP the Grafana login page is publicly reachable from the internet. |
stateful_fs_group | 472 | High | Any other value prevents Grafana from writing to PVC mounts, causing startup failures. |
memory_limit (in container_resources) | 2Gi | High | Below 512Mi Grafana OOMs on startup with large dashboard sets. |
min_instance_count | 1 | High | Scale-to-zero causes alert evaluation gaps during cold starts. |
max_instance_count | 1–3 | Medium | Multiple replicas share PostgreSQL but not in-memory alert state — alerts can fire duplicates. |
pdb_min_available vs min_instance_count | leave headroom | Medium | 1/1 can stall node upgrades (single pod cannot be evicted). |
enable_redis | false (default) | Low | Enabling without a valid redis_host raises a validation error at plan time. |
backup_retention_days | 7 (raise for prod) | Medium | Too short for compliance retention. |
For the foundation behaviour referenced throughout — IAM and Workload Identity, autoscaling, ingress and certificates, CI/CD, Cloud Armor, IAP, Binary Authorization, VPC-SC, backups, and image mirroring — see App_GKE. Grafana-specific application configuration shared with the Cloud Run variant is described in Grafana_Common.
Related guides
- Hands-on lab: Grafana on GKE Autopilot — deploy it step by step, with the console screens and commands at each stage.
- Grafana on Google Cloud Run — the same application on Cloud Run, for when you need the other deployment target.
- Grafana Common — Shared Application Configuration — the configuration shared by both deployment targets.
Need RAD to do something it does not do yet? Request it on the roadmap, or vote on what is already there.