Certification track: Professional Cloud Architect (PCA) · Professional Cloud Network Engineer (PCNE)
Azure AKS attached to a Google Cloud Fleet
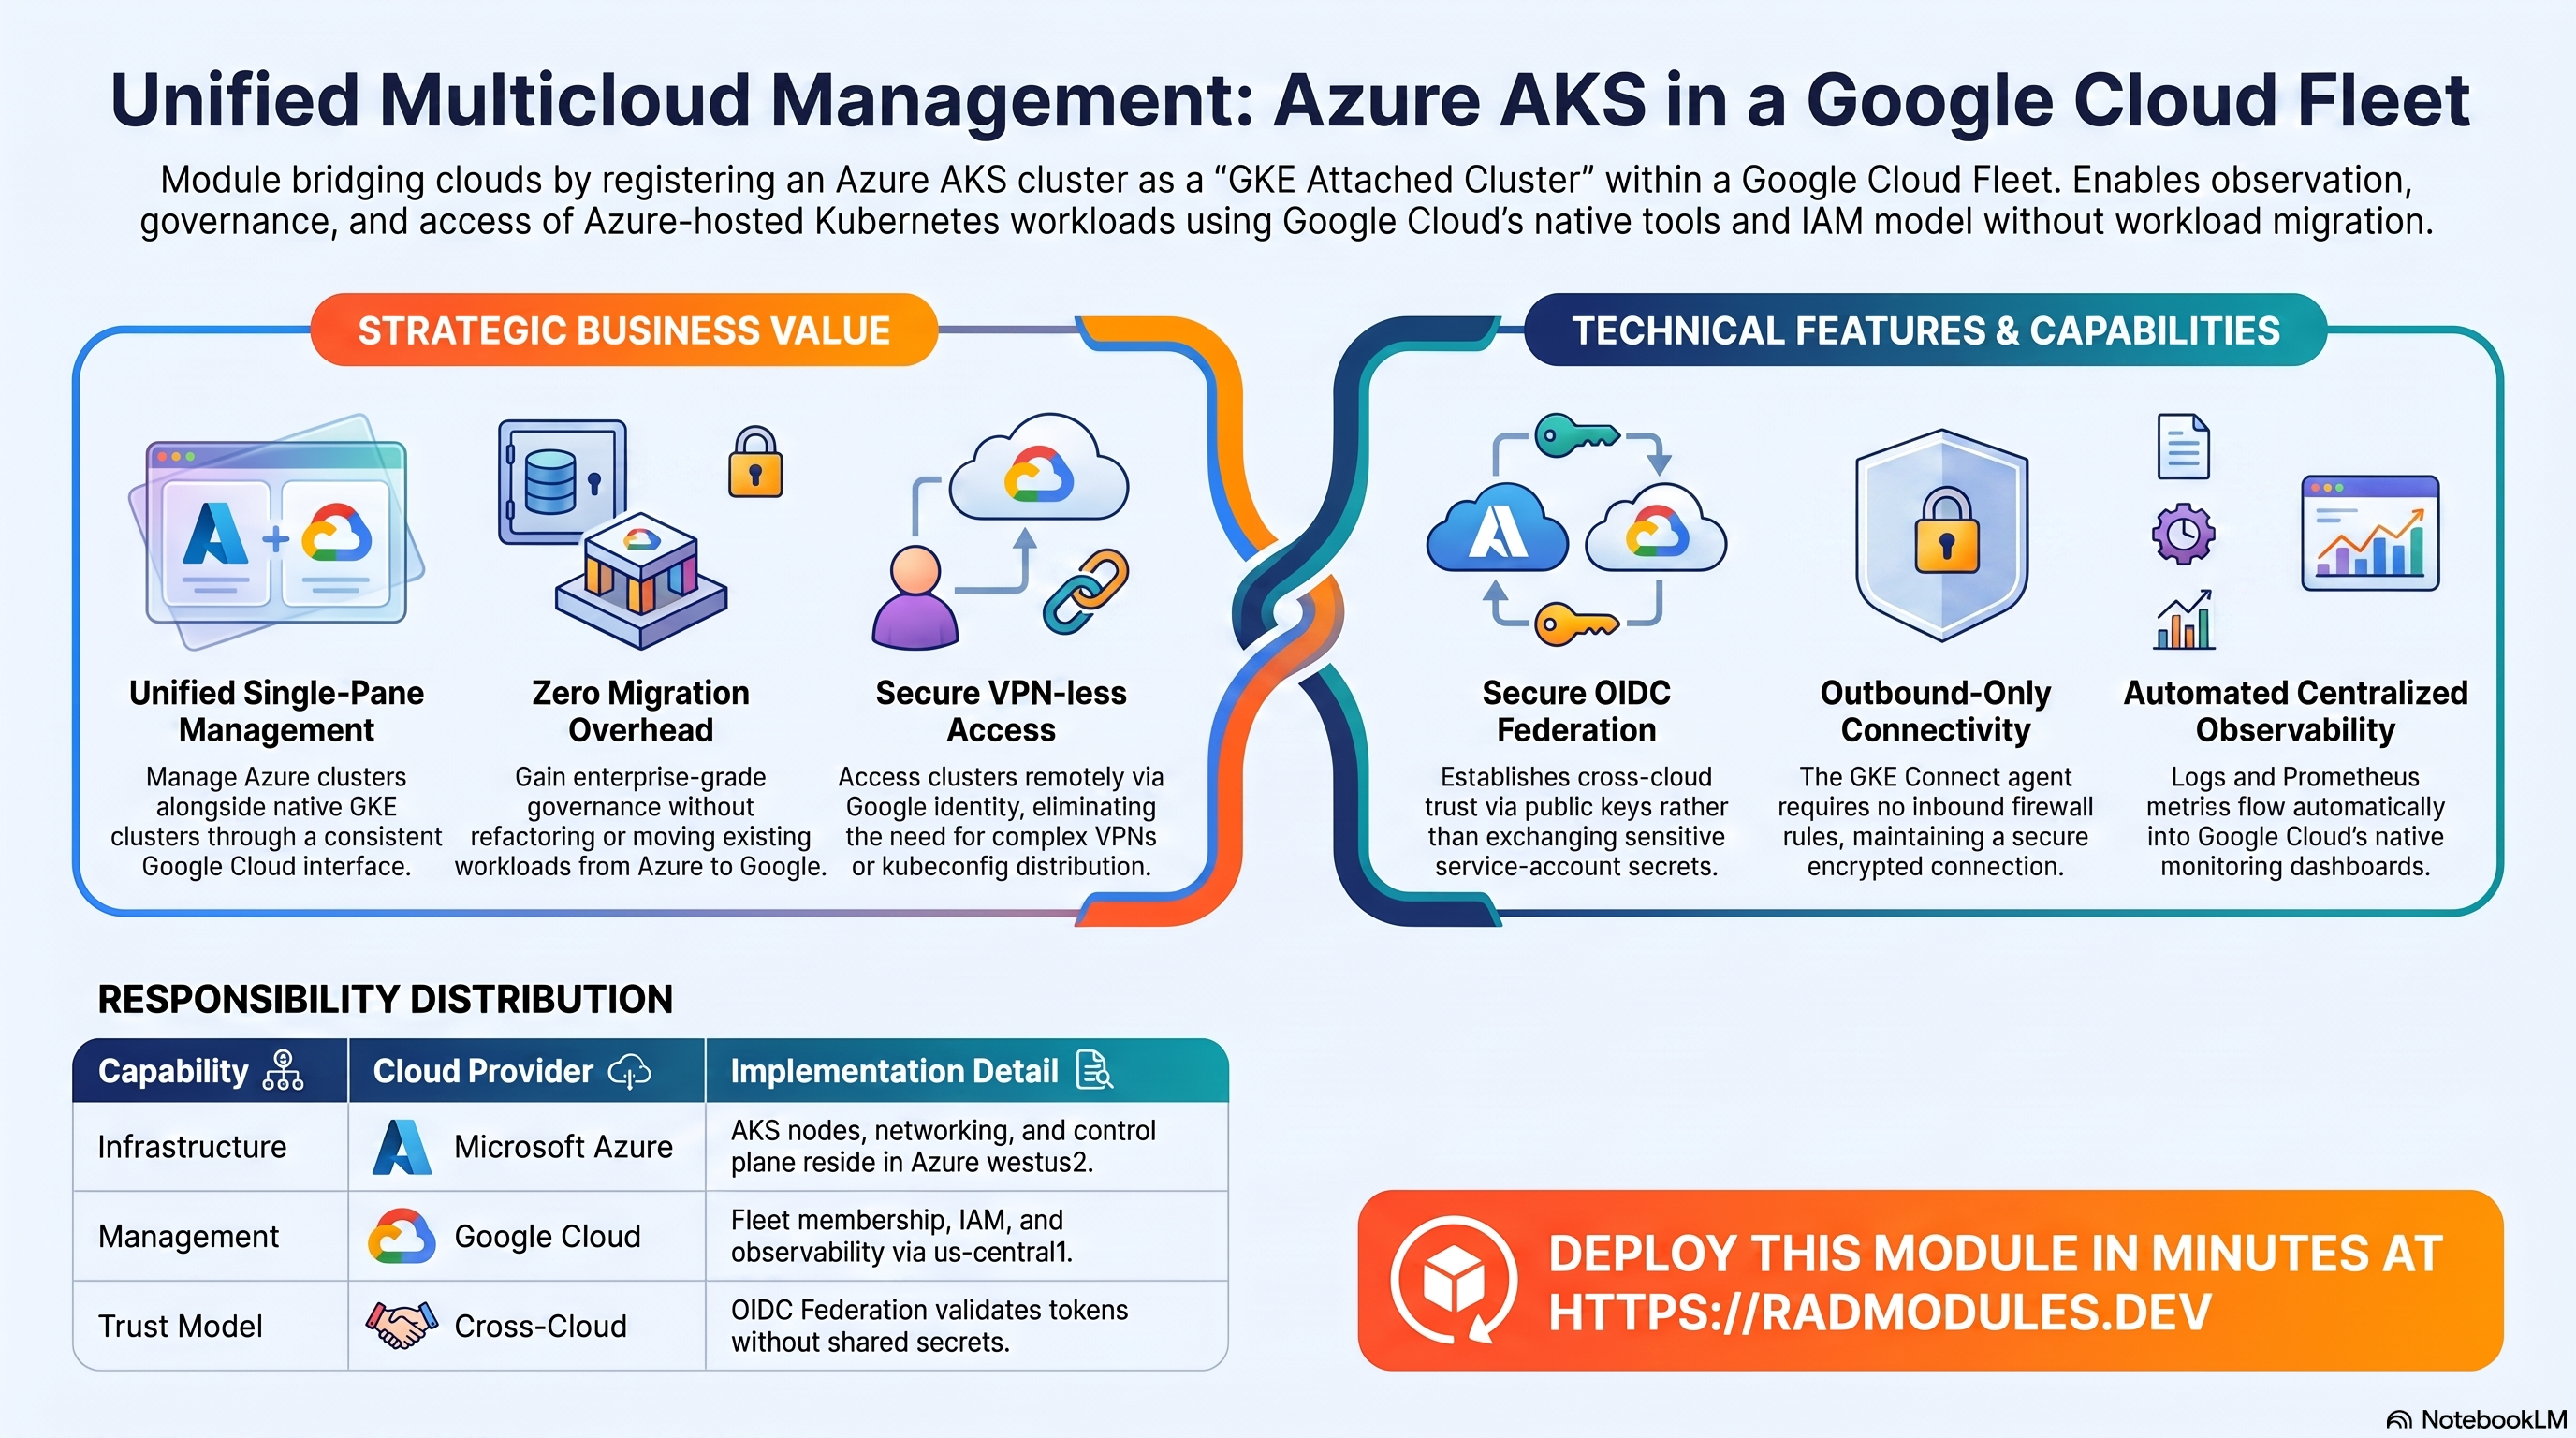
This module creates a Microsoft Azure Kubernetes Service (AKS) cluster and registers it with Google Cloud as a GKE Attached Cluster — a full member of a GKE Fleet. Once attached, the AKS cluster appears in the Google Cloud Console alongside any native GKE clusters in the project, and can be accessed, observed, and governed through the same Google Cloud tooling, IAM model, and observability stack used for GKE — without migrating or refactoring the workloads that run on it.
Unlike the application modules in this catalogue, this is a standalone module with no shared foundation. It owns its own Azure provider and creates resources in two clouds: an Azure Resource Group and AKS cluster on the Azure side, and a fleet membership plus managed logging and monitoring configuration on the Google Cloud side. The AKS cluster continues to run entirely in Azure; Google Cloud only gains a management plane over it. Trust between the two clouds is established with OIDC federation, so no service-account keys or shared secrets are exchanged.
1. Overview
The module provisions infrastructure across both clouds. On apply it (1) creates the Azure Resource Group and AKS cluster, (2) installs the GKE Connect agent onto the cluster via Helm, and (3) registers the cluster as a GKE Attached Cluster and enrols it in the project's fleet with managed logging, Managed Prometheus, and an admin-user list.
| Capability | Cloud service | Notes |
|---|---|---|
| Kubernetes cluster | Azure AKS | Created in Azure with a system-assigned managed identity, OIDC issuer enabled, and a default node pool (3 nodes, Standard_D2s_v3 by default). |
| Cluster networking | Azure Resource Group + role assignment | A Resource Group holds the cluster; the cluster's managed identity is granted Network Contributor so AKS can manage Azure load balancers for LoadBalancer Services. |
| Fleet membership | Google Cloud Fleet (GKE Hub) | The AKS cluster is registered as an attached cluster and becomes a fleet member, visible in the Console with distribution type aks. |
Remote kubectl access | Connect gateway | Engineers run kubectl against the AKS cluster using their Google Cloud identity — no Azure credentials, kubeconfig distribution, or VPN required. |
| Cross-cloud trust | OIDC federation | Google Cloud validates Kubernetes tokens against the AKS OIDC issuer's public keys; no shared secrets between clouds. |
| Centralised logging | Cloud Logging | System-component and workload logs from AKS flow into the same project's Log Explorer. |
| Centralised metrics | Cloud Monitoring (Managed Prometheus) | A collector on AKS forwards Kubernetes metrics to Cloud Monitoring; built-in GKE dashboards populate automatically. |
| Access control | Google Cloud IAM + Kubernetes RBAC | Users listed in trusted_users (plus the deploying identity) are granted cluster-admin on the attached cluster. |
Things to know up front:
- Azure credentials are required. Four sensitive inputs —
client_id,client_secret,tenant_id, andsubscription_id— identify an Azure AD service principal with at least Contributor rights on the target subscription. Without them the module cannot create the AKS cluster. They are marked sensitive and never appear in logs or plan output. - This is a two-cloud module. You need both a Google Cloud project (billing enabled) and an Azure subscription. Costs accrue on both sides — Azure for the AKS nodes, Google Cloud for fleet management and observability ingestion.
- The AKS cluster runs in Azure. The control plane, nodes, and networking all live in Azure (
westus2by default). Google Cloud only stores the attached-cluster record and fleet membership (inus-central1by default). - Platform version must match the Kubernetes version.
platform_version(the GKE Connect agent / attached-component version, e.g.1.34.0-gke.1) must be compatible withk8s_version(the AKS Kubernetes minor, e.g.1.34). - The deploying user is always an admin. The identity running the deployment is automatically added to the cluster admin list, in addition to any
trusted_users. - APIs are enabled non-destructively. The module enables several Google Cloud APIs (GKE Multi-Cloud, GKE Connect, Connect Gateway, GKE Hub, Anthos, Logging, Monitoring, and related metadata APIs). These are left enabled on teardown so other workloads in the project are not disrupted.
2. Cloud Services & How to Explore Them
The Google Cloud side is explored with gcloud and kubectl; the Azure side with the az CLI. Set PROJECT to your Google Cloud project, GCP_LOCATION to the fleet region, and CLUSTER to the attached-cluster name (the value of cluster_name_prefix). Confirm the exact membership name with gcloud container fleet memberships list.
A. GKE Attached Cluster & Fleet membership (Google Cloud)
The AKS cluster is registered as an attached cluster and enrolled in the fleet of the destination project. It appears in the Console with type Attached / distribution aks, alongside any native GKE clusters.
- Console: Kubernetes Engine → Clusters (the Azure cluster shows an Azure icon and type
Attached); Kubernetes Engine → Fleet shows membership and feature health. - CLI:
# Fleet membership
gcloud container fleet memberships list --project "$PROJECT"
gcloud container fleet memberships describe "$CLUSTER" --project "$PROJECT"

# Attached-cluster registration record (OIDC issuer, platform version, admin users)
gcloud container attached clusters list --location "$GCP_LOCATION" --project "$PROJECT"
gcloud container attached clusters describe "$CLUSTER" \
  --location "$GCP_LOCATION" --project "$PROJECT"
B. Connect gateway — kubectl access (Google Cloud)
Fleet enrolment activates the Connect gateway, which proxies kubectl to the AKS cluster using Google Cloud IAM. The kubeconfig entry points at Google's gateway endpoint, not the AKS API server, so no inbound access to Azure is needed.
- Console: Kubernetes Engine → Clusters → select the cluster → Connect.
- CLI:
# Configure kubectl to reach the cluster through the Connect gateway
gcloud container fleet memberships get-credentials "$CLUSTER" --project "$PROJECT"

kubectl config current-context        # connectgateway_<project>_global_<cluster>
kubectl get nodes -o wide
kubectl get namespaces
kubectl get pods --all-namespaces
C. Cloud Logging (Google Cloud)
System-component and workload logs are collected from AKS into the project's Log Explorer using the same schema as GKE, so existing GKE log queries work unchanged.
- Console: Logging → Logs Explorer.
- CLI:
# All recent logs from the attached cluster
gcloud logging read 'resource.labels.cluster_name="'"$CLUSTER"'"' \
  --project "$PROJECT" --limit 20

# Workload (container) logs in a namespace
gcloud logging read \
  'resource.type="k8s_container" AND resource.labels.cluster_name="'"$CLUSTER"'" AND resource.labels.namespace_name="default"' \
  --project "$PROJECT" --limit 20
D. Cloud Monitoring & Managed Prometheus (Google Cloud)
Managed Service for Prometheus is enabled on the cluster. A collector on the AKS nodes forwards Kubernetes metrics to Cloud Monitoring; the built-in GKE dashboards populate automatically.
- Console: Monitoring → Metrics Explorer (filter a
kubernetes.io/...metric bycluster_name); Monitoring → Dashboards → the GKE dashboards. - CLI:
gcloud monitoring metrics list \
  --filter='metric.type=starts_with("kubernetes.io/node")' --project "$PROJECT"
# Through the Connect gateway:
kubectl top nodes
kubectl top pods --all-namespaces
E. Azure AKS (Azure)
The cluster, its Resource Group, and node pool are managed in Azure. Authenticate the az CLI with the same service principal supplied to the module.
- Console: Azure Portal → Kubernetes services → the AKS cluster; Resource groups →
<cluster_name_prefix>-rg. - CLI:
az login --service-principal \
  --username "$ARM_CLIENT_ID" --password "$ARM_CLIENT_SECRET" --tenant "$ARM_TENANT_ID"

az aks list --subscription "$ARM_SUBSCRIPTION_ID" --output table
az aks show --resource-group "<cluster_name_prefix>-rg" \
  --name "<cluster_name_prefix>" --subscription "$ARM_SUBSCRIPTION_ID"
3. Behaviour
- What apply does. The module creates the Azure Resource Group and AKS cluster, grants the cluster's managed identity Network Contributor on the Resource Group, installs the GKE Connect agent onto the cluster via Helm, then registers the cluster as a GKE Attached Cluster and enrols it in the project's fleet. A first apply takes roughly 12–20 minutes; AKS provisioning in Azure is the longest phase.
- Outbound-only connectivity. The Connect agent maintains a persistent, encrypted, outbound connection from AKS to Google Cloud. The AKS API server does not need a public endpoint, and no inbound firewall rules or VPN are required in Azure.
- Connect-gateway access model. Access is two-layered: a Google Cloud IAM role on the project (e.g.
roles/gkehub.gatewayReader,gatewayEditor, orgatewayAdmin) authorises traversal of the gateway, and Kubernetes RBAC on the cluster authorises the specific API actions. Users intrusted_users(and the deploying identity) receive cluster-admin automatically. - Centralised observability is on by default. Logging is configured for both system components and workloads, and Managed Prometheus is enabled, with no further configuration after attachment.
- OIDC federation. Google Cloud trusts tokens issued by the AKS OIDC issuer by validating their signatures against the cluster's published public keys — there are no shared credentials between Azure and Google Cloud.
- Manual follow-up (optional). A service-mesh sub-module (Google Cloud Service Mesh / Istio) ships with the module but is not installed automatically. Installing it is a separate, manual step and is outside the scope of a standard deployment.
- Updates. Changing
platform_versionupdates only the attached-cluster registration / Connect agent — the AKS cluster itself is untouched. Changingnode_countorvm_sizereshapes the Azure node pool. Changingcluster_name_prefixforces resource recreation across both clouds (the cluster name does not incorporate the deployment ID, so two deployments with the same prefix in the same subscription and project will conflict). - Teardown. Destroy deregisters the cluster from the fleet, removes the Connect agent, and deletes the Azure Resource Group and AKS cluster. The Google Cloud APIs enabled during deployment are intentionally left enabled.
4. Configuration Variables
Variables are grouped exactly as they appear on the deployment platform.
Group 1 — Project & Identity
| Variable | Default | Description |
|---|---|---|
project_id | (required) | Destination Google Cloud project where the cluster is registered and the fleet membership is created. Must already exist. |
gcp_location | us-central1 | Google Cloud region where the attached-cluster record and fleet membership are stored and shown in the Console. Must support attached clusters. |
azure_region | westus2 | Azure region where the AKS cluster and its Resource Group are created. Feature and VM SKU availability varies by region. |
trusted_users | [] | Google account emails granted cluster-admin on the AKS cluster via the Connect gateway. The deploying identity is always included automatically. Entries must be non-blank and unique. |
client_id | (required, sensitive) | Azure AD application (client) ID of the service principal used to create and manage the AKS resources. |
client_secret | (required, sensitive) | Client secret for the Azure AD service principal. |
tenant_id | (required, sensitive) | Azure AD tenant (directory) ID for the Azure account. |
subscription_id | (required, sensitive) | Azure subscription ID where the AKS resources are provisioned. |
Group 4 — Cluster
| Variable | Default | Description |
|---|---|---|
cluster_name_prefix | azure-aks-cluster | Prefix for the cluster and associated resource names (lowercase letters, digits, hyphens). Used verbatim as the cluster name in both Azure and Google Cloud, and to derive the Resource Group (<prefix>-rg) and DNS prefix (<prefix>-dns). |
node_count | 3 | Number of nodes in the AKS default node pool. A minimum of 2 is recommended for high availability; higher counts raise Azure compute cost proportionally. |
k8s_version | 1.34 | Kubernetes minor version (major.minor) for the AKS cluster. Must be supported by AKS in azure_region; the patch version is managed by AKS. |
platform_version | 1.34.0-gke.1 | Attached-cluster platform version (the Connect agent / managed components installed on AKS). Its major.minor must match k8s_version. |
vm_size | Standard_D2s_v3 | Azure VM SKU for the node pool (e.g. Standard_D2s_v3 = 2 vCPU / 8 GB). Larger SKUs raise Azure cost; availability varies by region. |
5. Outputs
This module declares no outputs — there is no outputs definition, and no output values are surfaced by the deployment. The identifiers you need to operate the cluster must be derived or recorded manually:
- Attached-cluster / membership name — the value of
cluster_name_prefix(defaultazure-aks-cluster). Confirm the exact name withgcloud container fleet memberships list --project "$PROJECT". This name is required forget-credentials,describe, and most other commands. - Fleet location — the value of
gcp_location(defaultus-central1), needed forgcloud container attached clusterscommands. - Azure Resource Group —
<cluster_name_prefix>-rg, needed forazoperations and manual cleanup.
Record the membership name immediately after deployment; every Day-2 and teardown command depends on it.
6. Configuration Pitfalls & Sensible Defaults
Risk: Critical (data loss / outage / security) — High (service degraded) — Medium (cost or partial degradation) — Low (minor).
| Setting | Sensible value | Risk | Consequence if wrong |
|---|---|---|---|
client_id / client_secret / tenant_id / subscription_id | valid service-principal credentials, Contributor on the subscription | Critical | Missing or wrong credentials fail the apply at AKS creation; an under-privileged principal partially provisions and leaves orphaned Azure resources. The service principal needs subscription-level Contributor because the module creates the Resource Group itself. |
platform_version ↔ k8s_version | keep major.minor compatible (e.g. 1.34.0-gke.1 with 1.34) | High | An incompatible pairing fails attachment or leaves the Connect agent unhealthy, so the cluster never becomes manageable from Google Cloud. |
cluster_name_prefix | set once, unique per project/subscription | High | Changing after first deploy recreates the cluster across both clouds, destroying the Azure AKS cluster and any workloads on it. Reusing a prefix for a second deployment causes resource conflicts. |
trusted_users | the operators who need access | High | Omitting an operator leaves them unable to reach the cluster via the gateway; remember the deploying identity is always admin, and entries cannot be blank or duplicated. |
node_count | 3 (≥2 for HA) | Medium | 1 removes high availability — a single node failure or drain takes the cluster's workloads down and can interrupt the fleet connection; very high counts inflate Azure cost. |
vm_size | Standard_D2s_v3 | Medium | Undersized SKUs cause scheduling pressure and OOM kills; oversized SKUs inflate Azure cost; some SKUs are unavailable in certain regions. |
azure_region / gcp_location | regions that support AKS and attached clusters respectively | Medium | An unsupported region fails provisioning or attachment; mismatched regions add cross-region latency for management traffic. |
| Enabled Google Cloud APIs | leave enabled on teardown (default) | Low | The module deliberately does not disable APIs on destroy to avoid breaking other workloads in the shared project. |
For the Google Cloud and Azure operations referenced throughout — verifying fleet membership, connecting via the Connect gateway, exploring logs and metrics, and tearing the deployment down — see the AKS_GKE lab guide.