Certification track: Professional Cloud Developer (PCD) · Professional Cloud Architect (PCA)
Bank of Anthos on GKE
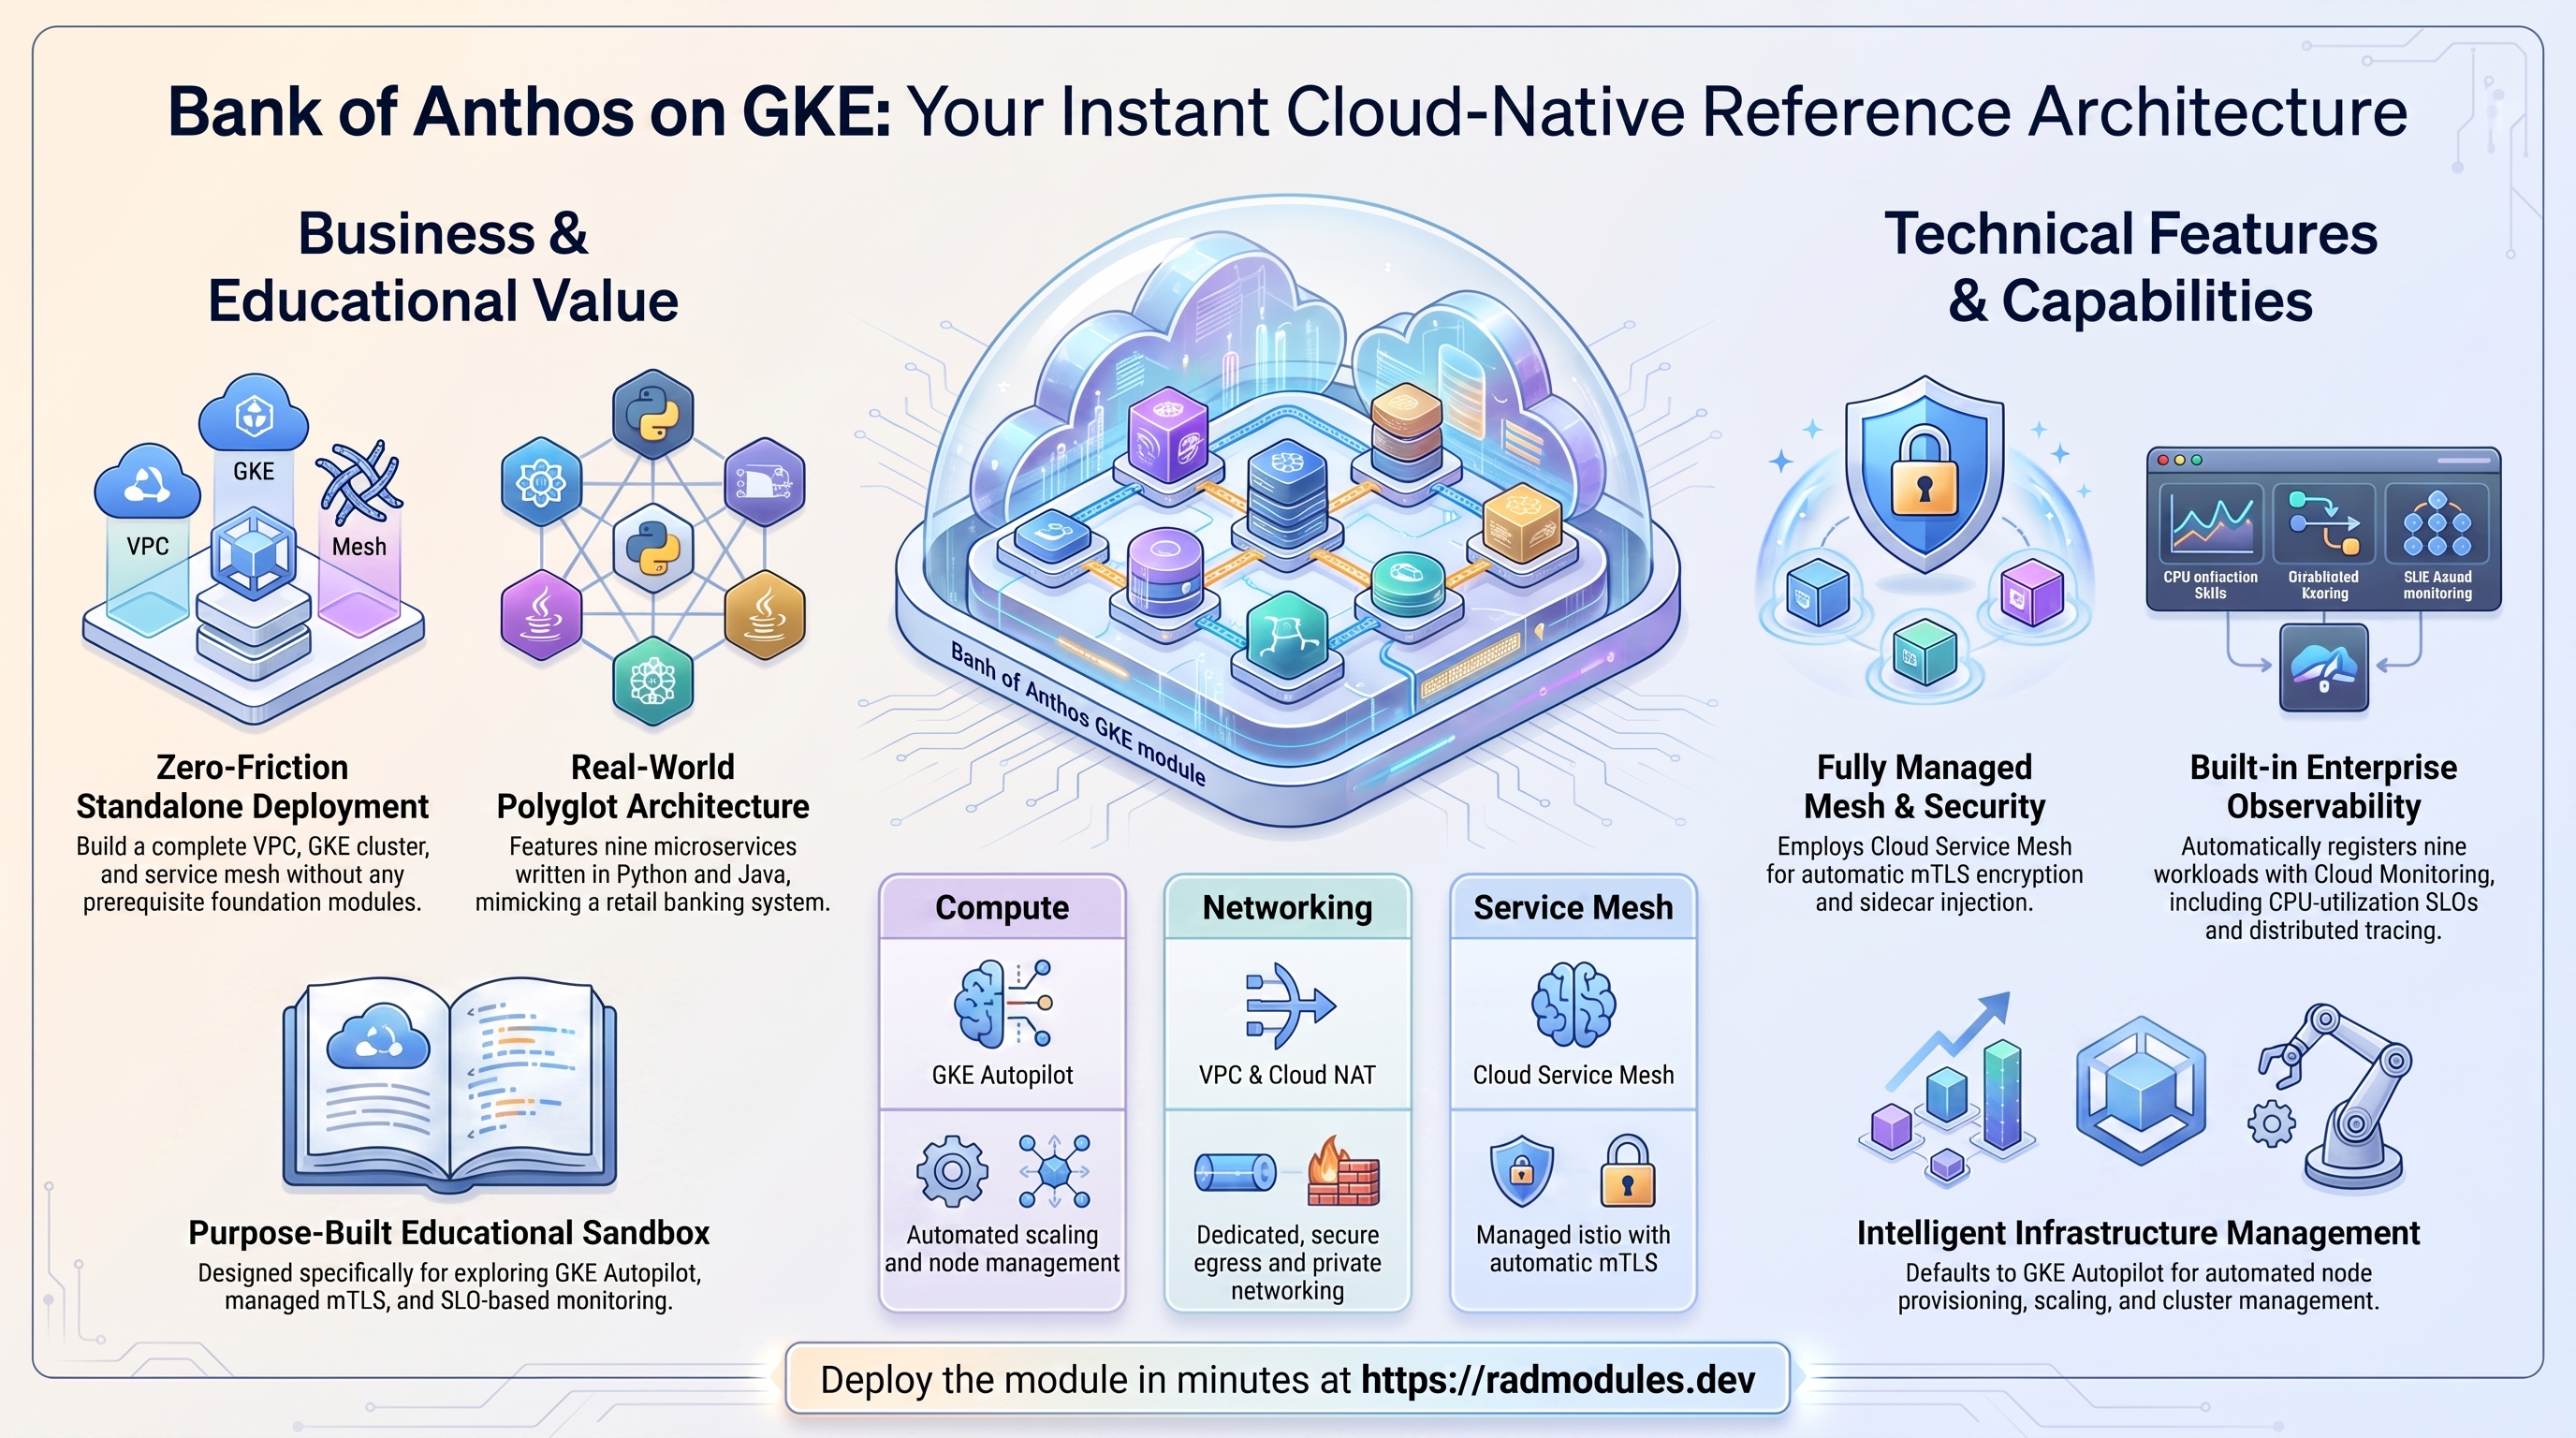
Bank of Anthos is Google Cloud's open-source reference banking application — a polyglot microservices demo (Python and Java services, two PostgreSQL databases, and a synthetic load generator) that mimics a retail bank with accounts, a transaction ledger, and a web frontend. This module is a standalone deployment: it builds its own VPC, GKE cluster, fleet membership, Cloud Service Mesh, and monitoring, then deploys the upstream Bank of Anthos manifests onto the cluster. It does not depend on any shared foundation module.
The module is intended for education and demonstration — exploring GKE Autopilot, a managed service mesh with automatic mTLS, fleet management, and Cloud Monitoring. It is not a production banking system.
This guide focuses on the Google Cloud services the module provisions and how to explore and operate them from the Console and the command line.
1. Overview
The module wires together a focused set of Google Cloud services around the Bank of Anthos workload:
| Capability | Google Cloud service | Notes |
|---|---|---|
| Compute | GKE Autopilot (or Standard) | Single regional cluster; Autopilot is the default and provisions/scales nodes automatically |
| Network | VPC, subnet, Cloud Router + Cloud NAT, firewall rules | A dedicated VPC with VPC-native secondary ranges for pods and services; NAT for egress |
| Service mesh | Cloud Service Mesh (Google-managed Istio) | Enabled via the fleet with MANAGEMENT_AUTOMATIC; injects Envoy sidecars and enforces mTLS |
| Fleet | GKE Hub / Fleet membership | The cluster is registered in the fleet, which is required to enable the mesh feature |
| Ingress | Cloud Load Balancing (external L4) | The frontend is exposed via the upstream frontend Service of type LoadBalancer; a global static IP is also reserved |
| Observability | Cloud Monitoring, Managed Service for Prometheus, Cloud Logging, Cloud Trace | Managed Prometheus on the cluster; one monitored service + CPU-utilisation SLO per workload |
| Application | Bank of Anthos v0.6.7 workloads | Nine microservices + two PostgreSQL StatefulSets in the bank-of-anthos namespace |
Things to know up front:
- This is a standalone module. It creates its own VPC, GKE cluster, and supporting infrastructure. There is no separate platform/foundation module to deploy first — only a GCP project with billing enabled.
- Autopilot is the default.
create_autopilot_cluster = truegives a fully Google-managed cluster. Set it tofalsefor a Standard cluster, in which case the module provisions a 2-node Spot node pool (e2-standard-2) and a dedicated node service account with Workload Identity. - The application is exposed over plain HTTP (L4). The Bank of Anthos
frontendService is typeLoadBalancer, so it receives a regular external IP serving HTTP. The module also reserves a global static IP namedbank-of-anthos, but the demo does not provision an HTTPS load balancer, managed TLS certificate, or custom domain. - The mesh control plane is fully managed. With
enable_cloud_service_mesh = true, Google runs the Istio control plane — noistiodpods run in your cluster. Thebank-of-anthosnamespace is labelledistio.io/rev=asm-managed, which triggers automatic Envoy sidecar injection so every pod runs2/2. - Apply waits for the mesh to be ready. Provisioning verifies the fleet membership and mesh control plane reach
ACTIVEbefore deploying the application, so first deploys take a while (roughly 30–45 minutes). - Config Management inputs are present but not active.
enable_config_managementand its related inputs exist for forward compatibility, but this module does not currently provision Anthos Config Management / Config Sync resources. Leave it at the default. - The application manifests are fetched from GitHub at apply time. The module downloads the Bank of Anthos
v0.6.7release archive and applies its Kubernetes manifests withkubectl. Outbound internet access from the deployment runner is required.
2. Google Cloud Services & How to Explore Them
All commands assume you have run
gcloud container clusters get-credentials <cluster> --region <region> --project <project>
and that PROJECT and REGION are set. The cluster name defaults to gke-cluster; the application namespace is bank-of-anthos.
A. GKE — the cluster and the banking workload
The cluster runs all nine Bank of Anthos microservices and two PostgreSQL StatefulSets in the bank-of-anthos namespace. On Autopilot, nodes are provisioned and scaled automatically; on Standard, a 2-node Spot node pool is created. Managed Prometheus, the GCS FUSE CSI driver, the Gateway API, GKE cost management, and BASIC security posture (with workload vulnerability scanning) are all enabled on the cluster.
- Console: Kubernetes Engine → Clusters (mode, version, add-ons); Workloads (the nine services); Security Posture (vulnerability and misconfiguration findings).
- CLI:
gcloud container clusters describe gke-cluster --region "$REGION" --project "$PROJECT" \
  --format="table(name,autopilot.enabled,currentMasterVersion,status)"
kubectl get pods -n bank-of-anthos          # expect every pod 2/2 (app + Envoy sidecar)
kubectl get statefulset,pvc -n bank-of-anthos
kubectl get nodes -o wide
B. Cloud Service Mesh
Cloud Service Mesh is enabled as a fleet feature with MANAGEMENT_AUTOMATIC. Google manages the Istio control plane; Envoy sidecars are injected into every pod in the bank-of-anthos namespace, encrypting all pod-to-pod traffic with mTLS and emitting golden-signal telemetry without any application instrumentation.
- Console: Kubernetes Engine → Service Mesh — live topology graph, per-service latency/traffic/errors, control-plane health.
- CLI:
gcloud container fleet mesh describe --project "$PROJECT"
kubectl get namespace bank-of-anthos --show-labels        # istio.io/rev=asm-managed
# Confirm each pod has an istio-proxy sidecar:
kubectl get pods -n bank-of-anthos \
  -o jsonpath='{range .items[*]}{.metadata.name}{"\t"}{range .spec.containers[*]}{.name}{" "}{end}{"\n"}{end}'
C. GKE Fleet
The cluster is registered as a fleet membership immediately after creation. Fleet membership is the prerequisite for enabling the mesh feature, and it provides a single place to view feature state across clusters.
- Console: Kubernetes Engine → Fleets — membership state and enabled features.
- CLI:
gcloud container fleet memberships list --project "$PROJECT"
gcloud container fleet memberships describe gke-cluster --location global --project "$PROJECT"
gcloud container fleet features list --project "$PROJECT"
D. Networking & load balancing
The module creates a dedicated VPC (GLOBAL routing) with a subnet that carries VPC-native secondary ranges for pods and services, a Cloud Router + Cloud NAT gateway for egress, and a set of firewall rules (load-balancer and NFS health-check ranges, IAP-tunnelled SSH, intra-VPC pod traffic, HTTP/HTTPS). A global static external IP named bank-of-anthos is reserved. The application frontend is reached through the upstream frontend Service of type LoadBalancer.
- Console: VPC network → VPC networks / Firewall; Network services → Cloud NAT and Load balancing; VPC network → IP addresses.
- CLI:
gcloud compute networks subnets list --project "$PROJECT" \
  --format="table(name,region,ipCidrRange,secondaryIpRanges[].rangeName)"
gcloud compute addresses list --global --project "$PROJECT"
# External IP the application is actually served on:
kubectl get svc frontend -n bank-of-anthos \
  -o jsonpath='{.status.loadBalancer.ingress[0].ip}'
E. Cloud Monitoring, Prometheus, Logging & Trace
Managed Service for Prometheus runs on the cluster. When monitoring is enabled, the module registers each of the nine workloads as a Cloud Monitoring service and attaches a CPU-limit-utilisation SLO to each. Pod stdout/stderr flows to Cloud Logging, and mesh sidecars export distributed traces to Cloud Trace.
- Console: Monitoring → Dashboards (GKE) and Services → SLOs; Logging → Logs Explorer; Trace → Trace list.
- CLI:
gcloud monitoring services list --project "$PROJECT"
gcloud logging read 'resource.type="k8s_container" AND resource.labels.namespace_name="bank-of-anthos"' \
  --project "$PROJECT" --limit 50
F. The Bank of Anthos workloads
Nine services in three tiers: frontend (Python web UI); userservice, contacts, and accounts-db (account management plus PostgreSQL); ledgerwriter, balancereader, transactionhistory, and ledger-db (transactions plus PostgreSQL); and loadgenerator, which drives synthetic traffic so telemetry and SLOs have data. Services communicate over HTTP by Kubernetes DNS name; an RSA-signed JWT (stored as a Kubernetes Secret) authenticates users across services.
- CLI:
kubectl get all -n bank-of-anthos
kubectl logs -n bank-of-anthos deploy/frontend --tail=50
kubectl logs -n bank-of-anthos deploy/loadgenerator --tail=20
3. Behaviour
- Standalone provisioning. A successful apply creates the VPC and subnet (with pod/service secondary ranges), Cloud Router + NAT, firewall rules, the GKE cluster, the fleet membership, the Cloud Service Mesh feature, the monitored services and SLOs, a reserved global static IP, and the Bank of Anthos workloads.
- The Bank of Anthos components. With
deploy_application = truethe module deploys nine microservices —frontend,userservice,contacts,ledgerwriter,balancereader,transactionhistory,loadgenerator, and theaccounts-dbandledger-dbPostgreSQL databases — into thebank-of-anthosnamespace, along with the JWT signing/verification secret. - Mesh-first ordering. The apply enables the GKE Hub and mesh APIs, grants the GKE Hub service agent the roles it needs, registers the fleet membership, enables the mesh feature, and then waits (via polling) for the membership and mesh control plane to report
ACTIVEbefore deploying the application. This is why first deploys take roughly 30–45 minutes. - Application deployment. The module downloads the Bank of Anthos
v0.6.7release archive from GitHub, creates thebank-of-anthosnamespace labelledistio.io/rev=asm-managed, applies the JWT secret and the Kubernetes manifests withkubectl, and waits for all deployments to become available. - Mesh injection. Because the namespace carries the
asm-managedrevision label, every pod is injected with an Envoy sidecar at admission and runs2/2. All in-namespace traffic is mTLS-encrypted by default. - How the app is exposed. The upstream
frontendService is typeLoadBalancer, so Google Cloud assigns it an external IP serving plain HTTP on port 80. The reserved global static IP and the Gateway API add-on are available for advanced exposure patterns but are not wired into an HTTPS load balancer by this module. - Monitoring & SLOs. When
enable_monitoring = true, one Cloud Monitoring service and one CPU-limit-utilisation SLO (95% goal, daily calendar period, 5-minute windows) are created per workload, giving a ready-made SLO framework to explore. - Manual follow-up. TLS/HTTPS, a custom domain, IAP in front of the frontend, traffic-management policies (VirtualService/DestinationRule), and any GitOps/Config Sync setup are not provisioned by the module and must be configured manually after deploy if desired.
- Standard-mode extras. With
create_autopilot_cluster = false, the module additionally creates a node service account, a 2-node Spot node pool (e2-standard-2, 50 GB SSD), and the IAM bindings and Workload Identity pool that Autopilot would otherwise provide automatically. - Runtime notes. The release archive is re-downloaded on every apply, so updates re-fetch the manifests; the demo databases (
accounts-db,ledger-db) hold all account and transaction data and are deleted with the cluster on teardown.
4. Configuration Variables
Variables are grouped exactly as they appear on the deployment platform.
Group 1 — Project & Region
| Variable | Default | Description |
|---|---|---|
project_id | (uses default project) | Destination GCP project where the cluster and application are deployed. The provisioning service account must hold roles/owner in it. |
region | us-central1 | Region for the cluster, VPC, and all regional resources. Ensure quota is available. |
Group 2 — Network
| Variable | Default | Description |
|---|---|---|
create_network | true | Create a new VPC and subnet. Set false to use an existing network identified by network_name/subnet_name. |
network_name | vpc-network | Name of the VPC (created or referenced). |
subnet_name | vpc-subnet | Name of the subnet (created or referenced). |
ip_cidr_ranges | ["10.132.0.0/16", "192.168.1.0/24"] | CIDR blocks for the subnet. Only used when create_network = true; the first is the primary node range. |
Group 5 — Cluster
| Variable | Default | Description |
|---|---|---|
create_cluster | true | Create a new GKE cluster. Set false to deploy onto an existing cluster named by gke_cluster. |
create_autopilot_cluster | true | true for Autopilot (fully managed nodes); false for Standard (a 2-node Spot node pool is created). |
gke_cluster | gke-cluster | Name of the cluster (created or referenced). Also used as the fleet membership ID. |
release_channel | REGULAR | Upgrade cadence: RAPID, REGULAR, STABLE, or NONE. |
pod_cidr_block | 10.62.128.0/17 | Secondary range for pod IPs (VPC-native). Must not overlap node/service ranges. |
service_cidr_block | 10.64.128.0/20 | Secondary range for Kubernetes Service ClusterIPs. Must not overlap node/pod ranges. |
The platform also exposes
pod_ip_range(defaultpod-ip-range) andservice_ip_range(defaultservice-ip-range) — the alias names for the two secondary ranges above. Leave them at their defaults unless you are attaching to existing named ranges on an existing subnet.
Group 6 — Features
| Variable | Default | Description |
|---|---|---|
enable_monitoring | true | Enable Managed Prometheus and create the per-workload Cloud Monitoring services and SLOs. |
enable_cloud_service_mesh | true | Install and configure Cloud Service Mesh (managed Istio) with MANAGEMENT_AUTOMATIC — provides mTLS and mesh telemetry. |
cloud_service_mesh_version | 1.23.4-asm.1 | Mesh version to target. Used only when the mesh is enabled; must be compatible with the cluster version. |
enable_config_management | false | Reserved for Anthos Config Management. Not currently wired to any resource in this module — leave at default. |
config_management_version | 1.22.0 | Reserved ACM feature version (inactive — see above). |
config_sync_repo | (GCP ACM samples repo) | Reserved Config Sync Git repository URL (inactive — see above). |
config_sync_policy_dir | (quickstart multi-repo root) | Reserved Config Sync policy directory within the repo (inactive — see above). |
Group 7 — Application
| Variable | Default | Description |
|---|---|---|
deploy_application | true | Deploy the Bank of Anthos v0.6.7 microservices onto the cluster. Set false to provision the cluster and infrastructure only. |
5. Outputs
| Output | Description |
|---|---|
deployment_id | The deployment ID used to make resource names unique (the value you supplied, or null when auto-generated by the platform). |
project_id | The destination project ID the module deployed into. |
The application's external address is not surfaced as a Terraform output; retrieve it from the
frontendLoadBalancer Service:kubectl get svc frontend -n bank-of-anthos.
6. Configuration Pitfalls & Sensible Defaults
Risk: Critical (data loss / outage / security) — High (service degraded) — Medium (cost or partial degradation) — Low (minor).
| Setting | Sensible value | Risk | Consequence if wrong |
|---|---|---|---|
enable_cloud_service_mesh | true | High | With the mesh off, no sidecars are injected — pods run 1/1, there is no mTLS or mesh telemetry, and the mesh-readiness wait that gates the app deploy is skipped. |
deployment_id | set once (or leave auto) | High | Changing it after first deploy renames resources and forces recreation of the VPC/cluster — effectively a fresh deployment. |
pod_cidr_block / service_cidr_block / ip_cidr_ranges | non-overlapping CIDRs | High | Overlapping or too-small secondary ranges cause cluster creation to fail or exhaust pod/service IPs as the app scales. |
region | a region with quota | High | Insufficient CPU/IP/SSD quota in the chosen region fails cluster or node-pool creation midway through a long apply. |
enable_config_management | false | Medium | The inputs are not wired to any resource; enabling it sets expectations of GitOps/Config Sync that the module does not deliver. |
create_autopilot_cluster | true | Medium | Standard mode uses a 2-node Spot pool — cheaper but preemptible; nodes can be reclaimed, briefly disrupting workloads. Use Autopilot for steadier behaviour. |
| Application exposure (HTTP only) | add TLS/IAP manually | Medium | The frontend is served over plain HTTP on a public IP. For anything beyond a demo, front it with HTTPS and/or IAP after deploy. |
create_network = false | matching existing subnet | Medium | The existing subnet must already carry secondary ranges whose names match pod_ip_range/service_ip_range, or cluster creation fails. |
release_channel | REGULAR | Low | RAPID upgrades frequently (more churn); NONE leaves the cluster on manual upgrades and can drift behind supported versions. |
enable_monitoring | true | Low | Disabling it removes the per-workload monitored services and SLOs, so the SLO/observability walkthrough has nothing to show. |
For the end-to-end operational walkthrough — deploy, access, day-2 operations, observability, troubleshooting, and teardown — see the Bank of Anthos on GKE lab guide.