Netdata on Google Cloud Run
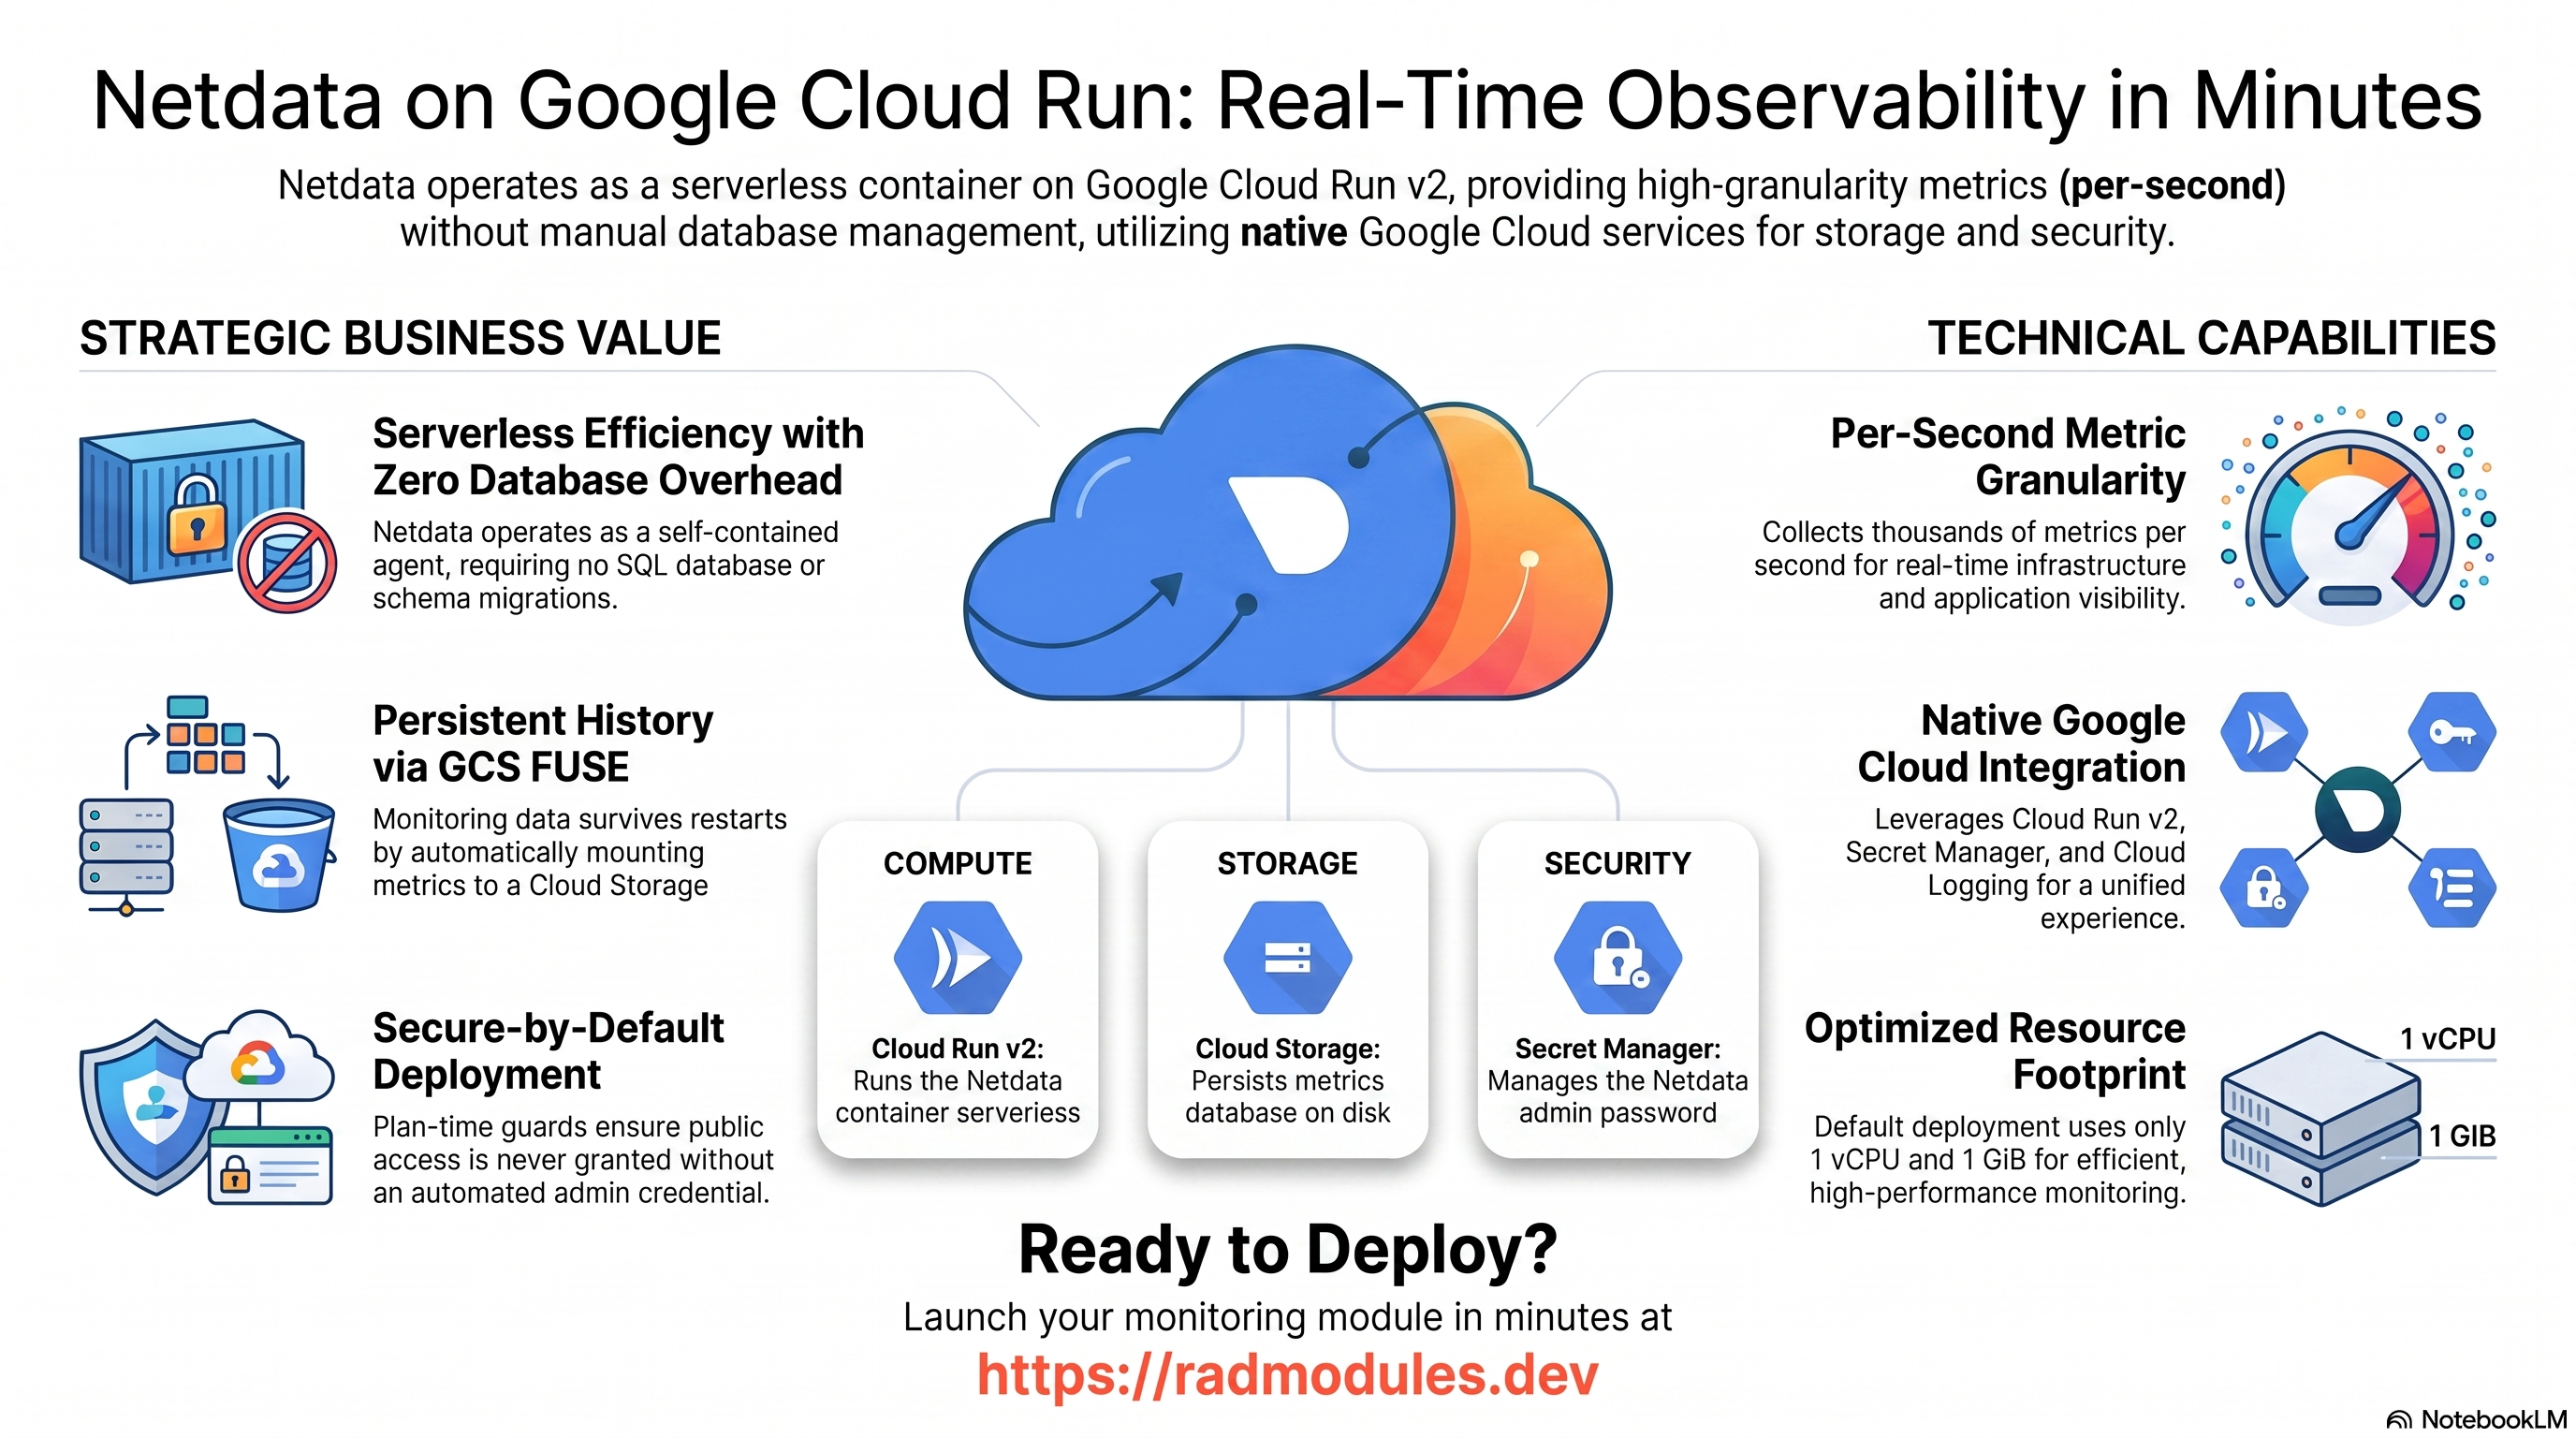
Netdata is an open-source, real-time infrastructure and application monitoring agent that collects thousands of metrics per second and serves per-second-granularity dashboards and a REST API. This module deploys Netdata on Cloud Run v2 on top of the App_CloudRun foundation, which provisions and manages the shared Google Cloud infrastructure.
This guide focuses on the cloud services Netdata uses and how to explore and operate them from the Google Cloud Console and the command line. For the mechanics common to every Cloud Run application — service identity, ingress and load balancing, scaling and concurrency, CI/CD, Cloud Armor, IAP, Binary Authorization, VPC Service Controls, backups, and the deployment lifecycle — refer to the App_CloudRun foundation guide rather than repeating them here.
What Netdata costs on RAD, and how that compares
Netdata on RAD's Cloud Run module costs about US$19 a month, with the module fee charged once in RAD credits. Need Netdata to stay up continuously, scale across pods, or run beside other Kubernetes workloads — or see the GKE guide for that option. If you only need it occasionally — a demo, a seasonal project, something you're evaluating — a RAD-managed project can be deleted and restored within 30 days for a handful of credits (under US$1) instead of paying for it to sit idle. See Pause it for free, below. Figures are as at 8 October 2026; sources are listed at the end of this section.
What you pay on RAD
RAD deploys Netdata, which is open source, so there is no licence fee per user. You pay for three things:
| In a Google Cloud project you own | In a project RAD manages for you | |
|---|---|---|
| Module fee, once per deployment | 40 credits (US$4 at the top-up price) | 36 credits (10% lower) |
| Build time | About 3-6 credits per build | The same |
| Google Cloud running cost | Billed by Google to your own billing account, about US$19 a month for the default configuration (table below) | Metered hourly in credits; RAD publishes 9 credits a day, about 270 a month (about US$27 at the top-up price, US$22 at the Scale plan's rate) |
| Who owns what | You own the project and its billing; RAD deploys and updates it | RAD owns the project, with guardrails, quotas and budget alerts; you get console access, and a minimum purchased balance is held in reserve |
10 credits cost US$1 on a one-off top-up, and less on a monthly plan. In a project RAD manages, the network and storage are shared by every application in the project, so a second application does not add a second set of them.
Default running cost in your own project (us-central1, Google list prices):
| Resource (module default) | Per month |
|---|---|
| Cloud Run, 1x vCPU / 1 GiB (warm) | US$13.14 |
| Cloud NAT and networking | US$5 |
| Cloud Storage (add-ons, backups) | US$1 |
| Total | about US$19 |
How it compares
| Option | Price | Who runs it |
|---|---|---|
| Netdata Cloud, Business plan | $4.50/node/month, billed annually | Netdata. Unlimited metrics, logs and retention; RBAC, SSO and audit logs |
| Netdata Cloud, Community plan | Free | Netdata. Capped at 5 connected nodes and 1 custom dashboard per room |
| RAD, Cloud Run, your own project | About US$19, plus US$4 once per deployment | RAD's automation, in your project |
| RAD, Cloud Run, a RAD-managed project | About 270 credits (US$22–27) | RAD |
| RAD, GKE Autopilot | See the GKE guide | RAD |
Netdata's own Cloud tier bills per connected node, which suits a fleet of servers; this module deploys a single Netdata instance watching itself (and whatever it's pointed at), so the comparison is one node against Netdata's own $4.50/node/month Business price. A self-hosted node is free of Netdata's own licence either way (the agent is open source); what RAD's fee pays for is the deployment, update and Cloud SQL-grade operational surface the Business plan would otherwise have to buy separately on your own server.
Pause it for free: delete a RAD-managed project, restore it when you need it
If Netdata runs in a project RAD manages for you, you have a second option that goes well beyond scaling to zero: delete the whole project, and restore it within 30 days for close to nothing. This suits Netdata you only need occasionally — a demo, an evaluation, a seasonal project — far better than running it continuously.
- How it works. Deleting a RAD-managed project unlinks its billing first, then asks Google to delete the project. Google does not remove the project immediately: it keeps it, recoverable, for 30 days. Because billing is already unlinked, nothing is charged while it waits. Unlike deleting one module, this does not tear down the compute resource one by one — the whole project, and everything in it, simply stops.
- Restoring costs a few credits, not a rebuild. Within 30 days, the project's owner can restore it. RAD asks Google to undelete the project and reattaches its billing account, then asks you to run Update on each deployment to confirm everything came back. Because nothing was individually destroyed, that Update finds the same resources already there — it is a check, not a rebuild, and an Update never charges the module fee again. That costs roughly a handful of credits (under US$1) in total for a typical 2-3-deployment chain.
- So a month of occasional use can cost a few dollars, not US$19. Deploy Netdata, use it for a while, delete the project. Restore it next time you want it, confirm with Update, and delete it again when you're done. You pay only for the module fee once, the builds, and whatever time Netdata was actually live.
- What this needs. You must own the project (not a bring-your-own one RAD only manages billing for), and you restore it yourself within the 30 days — after that, Google deletes it for good. Restoring is admitted like creating a new project: your purchased credit balance must still clear the tier's floor (100 credits for the sandbox tier most study and demo use fits). Google says most services are fully working again within 36 hours of a restore.
- One real gap: nightly backups don't survive. Backups are written to a bucket inside the project, and that bucket is not protected by Cloud Storage's soft-delete, so it is very likely gone as soon as you delete the project — even though the project itself is recoverable for 30 days. If you've customised Netdata and want to keep that work, copy a backup out (to Google Drive, or a bucket outside the project) before you delete. For a default installation with nothing irreplaceable in it, this does not matter.
Pay only while you use it, the other way: delete and redeploy
The option above only applies to a RAD-managed project; in your own project, or once the 30-day window has passed, the way to stop paying is to delete the deployment and deploy it again when you need it.
- What a redeploy costs. The module fee again plus the builds: about 45 credits (US$4.50) in your own project, or 41 credits in a RAD-managed one. Deleting saves money once Netdata would otherwise sit unused for about 7 days or more in your own project (about US$0.64 a day), or about 5 days or more in a RAD-managed one (9 credits a day).
- Most of the running cost is usually the database and any shared file/cache VM. They stop only when nothing else in the project uses them, so deleting Netdata while something else shares the project saves only this app's own compute part.
- Keep your data first. Nightly backups go to a bucket inside the deployment and are deleted with it, so copy the latest backup out before deleting if you want to keep it.
Lab sessions and Managed Environments
- Lab sessions, for training. A trainer runs a session for a class. Each participant gets Netdata in their own Google Cloud project for 15 minutes to 24 hours, within an allowance the trainer sets. Either the trainer funds every place, or each participant pays for their own. Everything is deleted when the session ends and unused credits go back to the trainer.
- Managed Environments, for consultancies. A partner runs Netdata for a client from a ring-fenced wallet it funds, and settles with the client directly. If the wallet runs low, billing pauses and the data is kept, so nobody receives an unexpected charge. At the end the partner hands the project over and the deployments become the client's own.
- Credits can be bought in more than 20 currencies, including XAF, XOF, NGN, GHS, KES and ZAR, by card, bank transfer or mobile money.
Sources (8 October 2026): Google Cloud list prices from the Cloud Billing Catalog API; Delete and restore projects for the 30-day recovery window and what it says about Cloud Storage objects without soft delete; RAD fees and the daily-credit estimates from radmodules.dev/pricing; Netdata Cloud pricing. Prices change; check each source before relying on a figure.
1. Overview
Netdata runs as a single container on Cloud Run v2, listening on port 19999. The deployment wires together a focused set of Google Cloud services:
| Capability | Google Cloud service | Notes |
|---|---|---|
| Compute | Cloud Run v2 | Single container, 1 vCPU / 1 GiB by default; listens on port 19999 |
| Database | None | Netdata has no SQL database — metrics are stored on disk under /var/lib/netdata |
| Object storage | Cloud Storage | One data bucket, mounted as a GCS FUSE volume at /var/lib/netdata |
| Cache & queue | None | Netdata uses no Redis (enable_redis is forced false) |
| Secrets | Secret Manager | 32-char NETDATA_ADMIN_PASSWORD, generated by default (enable_admin_password = true) |
| Ingress | Cloud Run URL / Cloud Load Balancing | Default all — public; a plan-time guard requires enable_admin_password = true to pair with it |
Sensible defaults worth knowing up front:
- No database. Netdata is a self-contained agent; there is no Cloud SQL instance,
no
db-initjob, and no schema migration.database_type = NONE. - Ingress defaults to
all(public), paired with a generated admin-password credential. Netdata's dashboard has no built-in authentication of its own, so a plan-time guard rejectsingress_settings = "all"unlessenable_admin_password = true— both default that way together so a fresh deploy passes plan out of the box. - The dashboard is unauthenticated regardless of
enable_admin_password. That flag (on by default) only generates a Secret-Manager-backedNETDATA_ADMIN_PASSWORDfor an operator-side auth layer (reverse proxy / Netdata Cloud claim) — it does not, by itself, add a login page to the raw dashboard. Restrictingress_settingstointernalor front the service withenable_iapif the exposed, unauthenticated dashboard is a concern. - Single instance by default.
min_instance_count = 1,max_instance_count = 1. Each Netdata instance holds its own local metrics database, so it does not scale horizontally into a shared store — keep it at one instance. - Metrics persist to a GCS FUSE bucket.
/var/lib/netdatais backed by a Cloud Storage bucket (enable_gcs_storage_volume = true) so the metrics database survives restarts and scale events. This requires the gen2 execution environment. - No Redis.
enable_redisis explicitly disabled; Netdata needs no cache/queue. - Health path is
/api/v1/info. Startup and liveness probes hit this endpoint, which returns a200JSON body once the agent is initialised. - The image is version-pinned via
NETDATA_VERSION.application_version = "latest"resolves tov2.2.6at build time rather than a non-existentlatestwrapper.
2. Google Cloud Services & How to Explore Them
All commands assume PROJECT and REGION are set. Service and resource names are
reported in the deployment Outputs.
A. Cloud Run — the Netdata service
Netdata runs as a Cloud Run v2 service listening on port 19999. Each deployment creates an immutable revision; because Netdata keeps its metrics on a single local/ GCS-backed database, it is normally run as a single instance rather than autoscaled.
- Console: Cloud Run → select the service for revisions, traffic, logs, and metrics.
- CLI:
gcloud run services list --project "$PROJECT" --region "$REGION" \
  --filter="metadata.name~netdata"
gcloud run services describe <service-name> --project "$PROJECT" --region "$REGION"
gcloud run revisions list --service <service-name> --project "$PROJECT" --region "$REGION"
# Confirm the injected listener port / admin password env:
gcloud run services describe <service-name> --region "$REGION" \
  --format='value(spec.template.spec.containers[0].env)'
See App_CloudRun for scaling, concurrency, execution environment, and traffic splitting.
B. Cloud Storage — metrics persistence
A dedicated Cloud Storage bucket is provisioned and mounted as a GCS FUSE
volume at /var/lib/netdata, where Netdata keeps its metrics database, alarm log,
and health state. This persists monitoring history across revision restarts and
redeploys. GCS FUSE requires the gen2 execution environment.
- Console: Cloud Storage → Buckets.
- CLI:
gcloud storage buckets list --project "$PROJECT" --filter="name~netdata"
gcloud storage ls gs://<data-bucket>/          # bucket name is in the Outputs
See App_CloudRun for GCS Fuse and CMEK options.
C. Secret Manager
By default (enable_admin_password = true) a single 32-character secret
(secret-<prefix>-netdata-admin-password) is generated and injected as
NETDATA_ADMIN_PASSWORD. No other application secrets are created (there is no
database password because there is no database).
- Console: Security → Secret Manager.
- CLI:
gcloud secrets list --project "$PROJECT" --filter="name~netdata-admin-password"
gcloud secrets versions access latest --secret=<secret-name> --project "$PROJECT"
See App_CloudRun for injection and rotation details.
D. Networking & ingress
By default the service uses ingress_settings = "all" (public) paired with
enable_admin_password = true — the module's validation guard requires the password
flag whenever ingress is all, and both default that way together. The dashboard
itself has no built-in login regardless, so for a genuinely locked-down deployment set
ingress_settings = "internal" (VPC-only) or front the public service with
enable_iap / an external HTTPS load balancer + basic-auth. The netdata_url output
reports the service URL (port 19999).
- Console: Cloud Run (service URL); Network services → Load balancing.
- CLI:
gcloud run services describe <service-name> --region "$REGION" --format='value(status.url)'
gcloud compute addresses list --project "$PROJECT"
See App_CloudRun.
E. Cloud Logging & Monitoring
Container logs flow to Cloud Logging; Cloud Run metrics flow to Cloud Monitoring,
with an optional uptime check (targeting /api/v1/info) and alert policies.
- Console: Logging → Logs Explorer; Monitoring → Dashboards / Alerting.
- CLI:
gcloud run services logs read <service-name> --project "$PROJECT" --region "$REGION" --limit 50
3. Netdata Application Behaviour
- No database bootstrap. There is no
db-initjob and no schema migration. The agent writes its round-robin metrics database directly to/var/lib/netdata(the GCS FUSE volume) on first start. - Metrics persistence. Monitoring history survives restarts only because
/var/lib/netdatais backed by the Cloud Storage bucket. If you disableenable_gcs_storage_volume(or the bucket is empty), each new revision starts with a blank metrics database. - Unauthenticated dashboard. Netdata's local dashboard and REST API on port 19999
have no built-in login, even though
ingress_settings = "all"andenable_admin_password = trueare both the module defaults. Setingress_settings = "internal"or place an authenticating proxy in front if the publicly-exposed, unauthenticated dashboard is a concern.enable_admin_passwordprovides a stable credential for that proxy / for the Netdata Cloud claim flow — it does not lock the raw dashboard by itself. - Health path. Startup and liveness probes target
/api/v1/info, which returns a200JSON body once the agent is initialised. Verify it:# from within the VPC (or after port-forwarding / LB):
curl -s "$NETDATA_URL/api/v1/info" | head - Single-instance operation. Because each instance owns its local metrics DB,
keep
min_instance_count = max_instance_count = 1. Scaling out produces independent, non-federated agents, not a shared dashboard. - Netdata Cloud (optional). To centralise multiple agents, claim this instance to Netdata Cloud post-deploy (via a claim token / rooms env) — an operator step, not provisioned by the module.
4. Configuration Variables
Variables are grouped exactly as they appear on the deployment platform. Only settings specific to or notable for Netdata are listed; every other input is inherited from App_CloudRun with its standard behaviour.
Group 3 — Application Identity
| Variable | Default | Description |
|---|---|---|
application_name | netdata | Base name for resources. Do not change after first deploy. |
application_version | latest | Netdata image tag; latest resolves to v2.2.6 at build time. Pin a specific tag in production. |
enable_admin_password | true | Generate a 32-char NETDATA_ADMIN_PASSWORD in Secret Manager. Required to be true whenever ingress_settings = "all" (the module default pairing). |
All other inputs follow standard App_CloudRun behaviour.
Group 4 — Runtime & Scaling
| Variable | Default | Description |
|---|---|---|
deploy_application | true | Set false to provision infrastructure only. |
cpu_limit | 1000m | CPU per instance. |
memory_limit | 1Gi | Memory per instance; raise if monitoring many collections. |
min_instance_count | 1 | Keep at 1 — Netdata holds a per-instance local metrics DB. |
max_instance_count | 1 | Keep at 1; scaling out yields independent, non-federated agents. |
container_port | 19999 | Port Netdata listens on (dashboard + REST API). |
enable_cloudsql_volume | false | No Cloud SQL — Netdata has no database. |
All other inputs follow standard App_CloudRun behaviour.
Group 5 — Access & Ingress Control
| Variable | Default | Description |
|---|---|---|
ingress_settings | all | Public by default, paired with enable_admin_password = true (a plan-time guard requires the pairing). Set internal for VPC-only access since the dashboard itself has no built-in login regardless of the password flag. |
vpc_egress_setting | PRIVATE_RANGES_ONLY | Route only RFC 1918 traffic via the VPC. |
enable_iap | false | Google sign-in in front of an external LB — the recommended way to expose Netdata publicly. |
All other inputs follow standard App_CloudRun behaviour.
Group 10 — Storage & Filesystem
| Variable | Default | Description |
|---|---|---|
create_cloud_storage | true | Create the GCS data bucket (the /var/lib/netdata FUSE mount). |
storage_buckets | [] | Additional buckets beyond the auto-provisioned data bucket. |
gcs_volumes | [] | Extra GCS Fuse mounts (requires gen2). The /var/lib/netdata mount is added automatically. |
enable_nfs | false | Off by default; Netdata does not require NFS. |
All other inputs follow standard App_CloudRun behaviour.
Group 12 — Database Backend
| Variable | Default | Description |
|---|---|---|
database_type | NONE | Fixed to NONE by Netdata_Common — Netdata has no SQL database. Not referenced. |
All other inputs follow standard App_CloudRun behaviour.
Group 14 — Observability & Health
| Variable | Default | Description |
|---|---|---|
startup_probe | HTTP /api/v1/info, 15s delay, 10 retries | Startup probe; /api/v1/info returns 200 JSON when ready. |
liveness_probe | HTTP /api/v1/info, 30s delay | Liveness probe. |
uptime_check_config | disabled, path /api/v1/info | Optional Cloud Monitoring uptime check (only fires when the endpoint is publicly reachable). |
All other inputs follow standard App_CloudRun behaviour.
5. Outputs
Returned on a successful deployment — the quickest way to locate and explore the running resources.
| Output | Description |
|---|---|
service_name | Cloud Run service name. |
netdata_url | Service URL for the Netdata dashboard/API (port 19999) — publicly reachable by default (ingress_settings = "all"); restricted to the VPC if ingress_settings = "internal". |
service_location | Region the service runs in. |
stage_services | Stage-specific service details (Cloud Deploy). |
load_balancer_ip / load_balancer_url | External HTTPS load balancer IP / URL (when enabled). |
storage_buckets | Created Cloud Storage buckets (includes the /var/lib/netdata data bucket). |
network_name / network_exists / regions | VPC network, presence, available regions. |
container_image / container_registry | Deployed image and Artifact Registry repo. |
monitoring_enabled / monitoring_notification_channels / uptime_check_names | Monitoring status, channels, uptime checks. |
initialization_jobs | Names of any setup jobs (empty by default — Netdata has none). |
deployment_id / tenant_id / resource_prefix | Naming identifiers. |
project_id / project_number | Project identifiers. |
cicd_enabled / github_repository_url / github_repository_owner / github_repository_name / cicd_configuration | CI/CD status and details. |
artifact_registry_repository / cloudbuild_trigger_name / cloudbuild_trigger_id | Registry and build trigger. |
vpc_sc_enabled / vpc_sc_perimeter_name / vpc_sc_dry_run_mode | VPC-SC status. |
audit_logging_enabled / artifact_registry_cmek_enabled | Audit logging and CMEK status. |
6. Configuration Pitfalls & Sensible Defaults
Risk: Critical (data loss / outage / security) — High (service degraded) — Medium (cost or partial degradation) — Low (minor).
Inherited plan-time validation. This module passes its configuration through the App_CloudRun foundation engine, which validates values and combinations at plan time. In addition,
Netdata_CloudRunadds its own guards:min_instance_count ≤ max_instance_count, andingress_settings = "all"is rejected unlessenable_admin_password = true. Invalid configuration fails the plan with a clear, named error before any resource is created.
| Setting | Sensible value | Risk | Consequence if wrong |
|---|---|---|---|
ingress_settings + enable_admin_password | Defaults to all + enable_admin_password = true; use internal for a genuinely locked-down deployment | Critical | The dashboard/REST API has no built-in login regardless of enable_admin_password — the default all ingress exposes full host metrics publicly unless fronted by enable_iap or another auth layer. The plan guard only blocks all without a password credential; it does not by itself secure the dashboard. |
enable_gcs_storage_volume (Common) / data bucket | Keep the GCS FUSE mount enabled | High | Without the /var/lib/netdata bucket, every revision starts with an empty metrics database — all history is lost on restart. |
max_instance_count | 1 | High | Scaling beyond 1 creates independent agents with separate local metrics DBs, not a shared dashboard — confusing, non-federated data. |
application_name | Set once | High | Immutable after first deploy; renaming recreates the service, secret, and bucket. |
container_port | 19999 | High | Netdata only listens on 19999; changing the port without changing NETDATA_LISTENER_PORT breaks the startup probe. |
execution_environment | gen2 | High | GCS FUSE for /var/lib/netdata requires gen2; gen1 cannot mount it. |
enable_iap | Enable when exposing externally | High | An external LB without IAP (or another auth layer) leaves the unauthenticated dashboard reachable. |
memory_limit | 1Gi (raise for many collections) | Medium | Under-sizing memory can OOM the agent when monitoring large numbers of charts. |
application_version | Pin a tag in production | Medium | latest floats to v2.2.6 at build time; pin to control upgrades. |
For the foundation behaviour referenced throughout — service identity, scaling and concurrency, ingress and load balancing, CI/CD, Cloud Armor, IAP, Binary Authorization, VPC-SC, backups, and image mirroring — see App_CloudRun. Netdata-specific application configuration shared with the GKE variant is described in Netdata_Common.
Related guides
- Hands-on lab: Netdata on Cloud Run — deploy it step by step, with the console screens and commands at each stage.
- Netdata on GKE Autopilot — the same application on Kubernetes, for when you need the other deployment target.
- Netdata Common — Shared Application Configuration — the configuration shared by both deployment targets.
- Deployed alongside Uptime Kuma on Google Cloud Run, Gatus on Google Cloud Run, Healthchecks on Google Cloud Run, Beszel on Google Cloud Run in the Monitoring & NOC solution.
Need RAD to do something it does not do yet? Request it on the roadmap, or vote on what is already there.